是德科技 | KEYSIGHT
XA5系列N9030B 信号分析仪,2Hz至3.6/8.4/13.6/26.5/44/50GHz 详细指标
台式信号与频谱分析仪
— The analyzer is within its calibration cycle. See the General section of this
— Under auto couple control, except that Auto Sweep Time Rules = Accy.
— For signal frequencies
<10 MHz, DC coupling applied.
— Any analyzer that has been stored at a temperature range inside the
allowed storage range but outside the allowed operating range must be
stored at an ambient temperature within the allowed operating range for at
least two hours before being turned on
条件:run recently enough to prevent an Alert message. If the Alert condition is
— The analyzer has been turned on at least
30 minutes with Auto Align set to
Normal, or if Auto Align is set to Off or Partial, alignments must have been
changed from “Time and Temperature” to one of the disabled duration
条件:Definitions and Requirements choices, the analyzer may fail to meet specifications without informing the user. If Auto Align is set to Light, performance is not warranted, and nominal performance will degrade to become a factor of 1.4 wider for any
specification subject to alignment, such as amplitude tolerances.
Keysight Technologies certifies that this product met its published
specifications at the time of shipment from the factory. Keysight Technologies
further certifies that its calibration measurements are traceable to the
International System of Units (SI) via national metrology institutes
Preamp Option P13
13.6 GHz
Preamp Option P26
26.5 GHz
条件:a. AC Coupled only applicable to frequency Options 503, 508, 513, and 526.
Mode” column), the desired 1st LO harmonic is higher than the tuned frequency by the 1st IF.
described as “3.5 to 8.4 GHz” represent nominal performance from 3.5 to 3.6 GHz, and warranted performance
LO Multiple (Nb) Band Overlapsc 0 (2 Hz to 3.6 GHz)d 1− 1 Options 503, 508, 513, 526, 544, 1 (3.5 to 8.4 GHz) 1 − 1 Options 508, 513, 526, 544, 550 2 (8.3 to 13.6 GHz) 1 − 2 Options 513, 526, 544
550
3 (13.5 to 17.1 GHz) 2 − 2 Options 526, 544
550
4 (17.0 to 26.5 GHz) 2 − 4 Options 526, 544
550
5 (26.4 to 34.5 GHz) 2 − 4 Options 544
550
6 (34.4 to 50 GHz) 4 − 8 Options 544
550
b. N is the LO multiplication factor. For ne gative mixing modes (as indicated by the “−” in the “Harmonic Mixing
c. In the band overlap regions, for exam ple
3.5 to 3.6 GHz, the analyzer may use either band for measurements, in
this example Band 0 or Band 1. The analyzer gives preference to the band with the better overall specifications
(which is the lower numbered band for all frequencies below
26 GHz), but will choose the other band if doing so is
necessary to achieve a sweep having minimum band crossings. For example, with CF =
3.58 GHz, with a span of
40 MHz or less, the analyzer uses Band 0, because the stop frequency is
3.6 GHz or less, allowing a span without
band crossings in the preferred band. If the span is between 40 and 160 MHz, the analyzer uses Band
1, because
the start frequency is above 3.5 GHz, allowing the sweep to be done without a band crossing in Band
1, though
the stop frequency is above 3.6 GHz, preventing a Band
0 sweep without band crossing. With a span greater than
160 MHz, a band crossing will be required: the analyzer sweeps up to 3.6 GHz in Band
0; then executes a band
crossing and continues the sweep in Band
1.
Specifications are given separately for each band in the band overlap regions. One of these specifications is for the
preferred band, and one for the alternate band. Continuing with the example from the previous paragraph
(3.58 GHz), the preferred band is band 0 (indicated as frequencies under
3.6 GHz) and the alternate band is band
1 (3.5 to 8.4 GHz). The specifications for the preferred band are warranted. The specifications for the alternate
band are not warranted in the band overlap region, but performance is nominally the same as those warranted
specifications in the rest of the band. Again, in this example, consider a signal at 3.58 GHz. If the sweep has been
configured so that the signal at 3.58 GHz is measured in Band 1, the analysis behavior is nominally as stated in the
Band
1 specification line (3.5 to 8.4 GHz) but is not warranted. If warranted performance is necessary for this sig-
nal, the sweep should be reconfigured so that analysis occurs in Band
0. Another way to express this situation in
this example Band 0/Band 1 crossing is this: The specifications given in the “Specifications” column which are
from 3.6 to 8.4 GHz.
d. Band
0 is extendable (set “Extend Low Band” to On) to 3.7 GHz instead of 3.6 GHz in instruments
with frequency Option 508
513 or 526.
条件:Aging Rate ±5 × 10⁻¹⁰/day (nominal)
Warm-up and Retraced Nominal 300 s after turn on ±1 × 10⁻⁷ of final frequency 900 s after turn on ±1 × 10⁻⁸ of final frequency
Precision Frequency Reference (Option EP1)
Accuracy ±[(time since last adjustment × aging rate) + temperature stability + calibration accuracya]b
Temperature Stability 20 to 30°C ±1.5 ×
10−8 Nominally linearc
Full temperature range ±5 ×
10−8
Total Aging 1 Year ±1 × 10⁻⁷ 2 Years ±1.5 ×
10−7
Achievable Initial Calibration Accuracye ±4 ×
10−8
Standby power to reference oscillator Not supplied
条件:(nominal) a. Calibration accuracy depends on how accurately the frequency standard was adjusted to 10 MHz. If the adjust- ment procedure is followed, the calibration accuracy is given by the specification “Achievable Initial Calibration
Accuracy.” b. The specification applies after the analyzer has been powered on for four hours. c. Narrow temperature range performance is nomina lly linear with temperature. For example, for 25±3º C, the stability would be only three-fifths as large as the warranted 25±5º C, thus ±0.9 × 10⁻⁸.
Residual FM (Center Frequency = 1 GHz 10 Hz RBW
10 Hz VBW)
≤0.25 Hz × Nf p-p in 20 ms
d. Standby mode does not apply power to the oscillator . Therefore warm-up applies every time the power is
turned on. The warm-up reference is one hour after turning the power on. Retracing also occurs every time
warm-up occurs. The effect of retracing is included within the “Achievable Initial Calibration Accuracy” term of
Frequency and Time e. The achievable calibration accuracy at the beginning of the calibration cycle includes these effects: 1) Temperature difference between the calibration environment and the use environment 2) Orientation relative to the gravitation field changing between the calibration environment and the use envi-
ronment 3) Retrace effects in both the calibration environment and the use environment due to turning the instrument power off.
4) Settability
Precision Frequency Reference (Option EP0)
Accuracy ±[(time since last adjustment × aging rate) + temperature stability + calibration accuracya]b
条件:Aging Rate ±2.5 × 10⁻¹⁰/day (nominal)
Warm-up and Retracec Nominal 300 s after turn on ±1 × 10⁻⁷ of final frequency 600 s after turn on ±1 × 10⁻⁸ of final frequency
Standby power Standby power is supplied to both the CPU and the frequency reference oscillator.
(nominal) a. Calibration accuracy depends on how accurately the frequency standard was adjusted to 10 MHz. If the adjust- ment procedure is followed, the calibration accuracy is given by the specification “Achievable Initial Calibration
Accuracy.” b. The specification applies after the analyzer has been powered on for four hours.
Full temperature range ±4.5 ×
10−9
Total Aging 1 Year ±3 ×
10−8
Achievable Initial Calibration Accuracyd ±3.1 ×
10−8
Residual FM (Center Frequency = 1 GHz 10 Hz RBW
10 Hz VBW)
≤0.25 Hz × Ne p-p in 20 ms
条件:Frequency and Time c. Standby mode applies power to the oscillator. Theref ore warm-up and retrace only apply if the power connec- tion is lost and restored. The warm-up reference is one hour after turning the power on. The effect of retracing is included within the “Achievable Initial Calibration Accuracy” term of the Accuracy equation.
d. The achievable calibration accuracy at the beginning of the calibration cycle includes these effects:
1) Temperature difference between the calibration environment and the use environment
2) Orientation relative to the gravitation field changing between the calibration environment and the use envi-
ronment 3) Retrace effects in both the calibration environment and the use environment due to turning the instrument power off.
4) Settability
Frequency Readout Accuracy ±(marker freq × freq ref accy + 0.10%× span + 5% × RBWa + 2 Hz +
0.5 × horizontal resolutionb)
条件:Example for EMCd ±0.0032% (nominal)
a. The warranted performance is only the sum of all errors under autocoupled conditions. Under non-autocoupled
conditions, the frequency readout accuracy will nominally meet the specification equation, except for conditions
in which the RBW term dominates, as explained in examples below. The nominal RBW contribution to frequency
widest autocoupled RBW), and 30% of RBW for the (manually selected) 4, 5, 6 and 8 MHz RBWs.
racy, compared to 120 kHz for the 0.10% × span term, for a total of 175 kHz.
c. Specifications apply to traces in most cases, but ther e are exceptions. Specifications always apply to the peak
detector. Specifications apply when only one detector is in use and all active traces are set to Clear Write. Spec-
readout accuracy is 2% of RBW for RBWs from 1 Hz to 390 kHz, 4% of RBW from 430 kHz through
3 MHz (the
First example: a 120 MHz span, with autocoupled RBW. The autocoupled ratio of span to RBW is
106:1, so
the RBW selected is 1.1 MHz. The 5% × RBW term contributes only
55 kHz to the total frequency readout accu-
Second example: a 20 MHz span, with a
4 MHz RBW. The specification equation does not apply because the
Span: RBW ratio is not autocoupled. If the equation did apply, it would allow
20 kHz of error (0.10%) due to the
span and 200 kHz error (5%) due to the RBW. For this non-autocoupled RBW, the RBW error is nominally
30%
or 1200 kHz.
b. Horizontal resolution is due to the marker reading out one of the trace points. The points are spaced by
span/(Npts – 1), where Npts is the number of sweep points. For example, with the factory preset value of 1001
sweep points, the horizontal resolution is span/1000. However, there is an exception: When both the detector
mode is “normal” and the span > 0.25 × (Npts – 1) × RBW, peaks can occur only in even-numbered points, so
the effective horizontal resolution becomes doubled, or span/500 for the factory preset case. When the RBW is
autocoupled and there are 1001 sweep points, that exception occurs only for spans
>750 MHz
ifications also apply when only one detector is in use in all active traces and the "Restart" key has been pressed
since any change from the use of multiple detectors to a single detector. In other cases, such as when multiple
simultaneous detectors are in use, additional errors of 0.5
1.0 or 1.5 sweep points will occur in some detectors
条件:points, the errors in excess of the bucket quantization limitation were negligible.
Frequency and Time d. In most cases, the frequency readout accuracy of the an alyzer can be exceptionally good. As an example, Key- sight has characterized the accuracy of a span commonly used for Electro-Magnetic Compatibility (EMC) testing using a source frequency locked to the analyzer. Ideally, this sweep would include EMC bands C and D and thus
sweep from 30 to 1000 MHz. Ideally, the analysis bandwidth would be
120 kHz at −6 dB, and the spacing of the
points would be half of this (60 kHz). With a start frequency of 30 MHz and a stop frequency of 1000.2 MHz and
a total of 16168 points, the spacing of points is ideal. The detector used was the Peak detector. The accuracy of
frequency readout of all the points tested in this span was with ±0.0032% of the span. A perfect analyzer with
this many points would have an accuracy of ±0.0031% of span. Thus, even with this large number of display
Frequency Countera See noteb
条件:a. Instrument conditions: RBW = 1 kHz, gate time = auto (100 ms), S/N ≥ 50 dB, frequency = 1 GHz
accuracy is ±0.100 Hz under the test conditions of footnote a. This error is a noisiness of the result. It will
increase with noisy sources, wider RBWs, lower S/N ratios, and source frequencies >1G H z .
Count Accuracy ±(marker freq × freq ref accy. +
0.100 Hz)
Delta Count Accuracy ±(delta freq. × freq ref accy. +
0.141 Hz)
b. If the signal being measured is locked to the same frequency reference as the analyzer, the specified count
Option 503 0 Hz
10 Hz to 3.6 GHz
Option 508 0 Hz
10 Hz to 8.4 GHz
Option 513 0 Hz
10 Hz to 13.6 GHz
Option 526 0 Hz
10 Hz to 26.5 GHz
Option 544 0 Hz
10 Hz to 44 GHz
Option 550 0 Hz
10 Hz to 50 GHz
Swept ±(0.1% × span + horizontal resolutiona)
FFT ±(0.1% × span + horizontal resolutiona)
条件:auto coupled and there are 1001 sweep points, that exception occurs only for spans >750 MHz.
Frequency and Time a. Horizontal resolution is due to the marker reading out one of the sweep points. The points are spaced by span/(Npts − 1), where Npts is the number of sweep points. For example, with the factory preset value of 1001 sweep points, the horizontal resolution is span/1000. However, there is an exception: When both the detector
mode is “normal” and the span > 0.25 × (Npts − 1) × RBW, peaks can occur only in even-numbered points, so
the effective horizontal resolution becomes doubled, or span/500 for the factory preset case. When the RBW is
1 μs to 6000 s
1 ms to 4000 s
±0.01% (nominal)
±40% (nominal)
±0.01% (nominal)
Sweep Trigger Free Run, Line, Video, External
1
External
2, RF Burst, Periodic Timer
条件:a. Delayed trigger is available with line, video, RF burst and external triggers.
b. Prior to A.19.28 software, zero span trigge r delay was limited to -150 ms to 500 ms.
Span ≥ 10 Hz
−150 ms to 500 ms
Span = 0 Hz
−10 s to +500 msb
Triggers Additional information on some of the triggers and gate sources
Video Independent of Display Scaling and Reference Level
条件:Maximum usable level Highest allowed mixer levela + 2 dB (nominal)
Minimum settable level
−170 dBm Useful range limited by noise
Triggers on the signal before detection, which is similar to the displayed signal
Detector = Average Triggers on the signal before detection, but with a
single-pole filter added to give similar smoothing to that of the average detector
Sweep Type = FFT Triggers on the signal envelope in a bandwidth
条件:Absolute ±2 dB + Absolute Amplitude Accuracy (nominal)
Bandwidth (−10 dB)
Most casesd
>80 MHz (nominal)
>80 MHz (nominal)
30 MHz (nominal)
16 MHz (nominal)
Frequency Limitations If the start or center frequency is too close to zero,
LO feedthrough can degrade or prevent triggering
How close is too close depends on the bandwidth listed above.
External Triggers See “Trigger Inputs” on page
91
TV Triggers Triggers on the leading edge of the selected sync
Amplitude Requirements
–65 dBm minimum video carrier power at the input
NTSC-4.43,
PAL-60, SECAM-L
条件:Low. b. Noise will limit trigger level range at high frequencies, such as above 15 GHz. c. With positive slope trigger. Trigger level with negative slope is nominally 1 to 4 dB lower than positive slope. d. Include RF Burst Level Type = Relative.
Line Selection
1 to 525, or 1 to 625
standard dependent a. The highest allowed mixer level depends on the IF Gain. It is nominally
–10 dBm for Preamp Off and IF Gain =
条件:Gate Delay Jitter 33.3 ns p-p (nominal)
Gate Length Range (Except Method = FFT) 1 μs to 5.0 s Gate length for the FFT method is fixed at 1.83/RBW, with nominally 2% tolerance.
Gate Delay Range
0 to 100.0 s
Gate Delay Settability 4 digits
≥100 ns
Gated FFT 和 Gated Video 频率和幅度误差
Nominally no additional error for gated measurements when the Gate Delay is greater than the MIN FAST setting
条件:Delay is greater than the MIN FAST setting 1.0 μs ≤ Gate < 10 μs Nominal error given by 100 ns × N × (Span/ST) ×
Gate ≥
10 μs Nominally no additional error when the Gate
√(SpanPosition × ST / GateLength); see footnotea
Gated LO Amplitude Errors Nominally no additional error when the Gate
Delay is greater than the MIN FAST setting
条件:Phase Noise Effects Gated LO method overrides the loop configuration to force single loop in place of dual loop.
Range
1 to 100,001 Zero and non-zero spans
Range (−3.01 dB bandwidth)
Bandwidths above 3 MHz are 4, 5, 6
8
and 10 MHz.a
Bandwidths
1 Hz to 3 MHz are spaced at
10% spacing using the E24 series (24
per decade): 1.0, 1.1, 1.2, 1.3, 1.5
1.6
1.8, 2.0, 2.2, 2.4, 2.7, 3.0, 3.3, 3.6
3.9
4.3, 4.7, 5.1, 5.6, 6.2, 6.8, 7.5, 8.2
9.1 in
条件:With Option B85 and Option RBEb 10, 15, 20, 25, 30, 40, 50, 60, and
70 MHz, in Spectrum Analyzer mode and
条件:With Option B1X and Option RBEb 10, 15, 20, 25, 30, 40, 50, 60, 70, 80,
100, and 133 MHz, in Spectrum Analyzer
m o d e a n d z e ro s p a n
条件:With Option B2X or B5X and Option RBEb 10, 15, 20, 25, 30, 40, 50, 60, 70, 80,
100, 133, 150
200, and 212 MHz, in
条件:RBW Range CF Range 1 Hz to 100 kHz All ±0.5% (0.022 dB) 110 kHz to 1.0 MHz < 3.6 GHz ±1.0% (0.044 dB) 1.1 to 2.0 MHz < 3.6 GHz ±0.07 dB (nominal)
2.2 to 3 MHz < 3.6 GHz 0 to −0.2 dB (nominal)
4 to 10 MHza < 3.6 GHz 0 to −0.4 dB (nominal)
Noise BW to RBW ratiod 1.056 ±2% (nominal)
1 Hz to 1.3 MHz RBW ±2% (nominal)
Selectivity (−60 dB/−3 dB) 4.1:1 (nominal)
Accuracy (−3.01 dB bandwidth)e
1.5 MHz to 3 MHz RBW
±7% (nominal)
±8% (nominal)
4 MHz to 10 MHz RBWa
±15% (nominal)
±20% (nominal)
条件:ter shape is approximately square. Support for Average detector was first added in SW Version A.23.05.
FFT Flattop. While the warranted performance only applies to the swept Gaussian filters, because only they are
kept under statistical process control, the other filters nominally have the same performance.
d. The ratio of the noise bandwidth (also known as the pow er bandwidth) to the RBW has the nominal value and tol-
Frequency and Time a. The 10 MHz RBW setting is only available on analyzers with instrument software version ≥ A.30.05 and which also have option FS1 installed. Otherwise, the maximum RBW setting is
8 MHz. b. Option RBE enables wider bandwidth filters in zero span in the Signal Analyzer mode. Available detectors are
Peak+ and Average. VBW filtering is disabled. Minimum sweep time is the greater of 200 μS or 200ns/pt. The fil-
c. The noise marker, band power marker , channel power and ACP all compute their results using the power band-
width of the RBW used for the measurement. Power bandwidth accuracy is the power uncertainty in the results
of these measurements due only to bandwidth-related errors. (The analyzer knows this power bandwidth for
each RBW with greater accuracy than the RBW width itself, and can therefore achieve lower errors.) The war-
ranted specifications shown apply to the Gaussian RBW filters used in swept and zero span analysis. There are
four different kinds of filters used in the spectrum analyzer: Swept Gaussian, Swept Flattop, FFT Gaussian and
erance shown. The RBW can also be annotated by its noise bandwidth instead of this
3 dB bandwidth. The accu-
racy of this annotated value is similar to that shown in the power bandwidth
条件:e. Resolution Bandwidth Accuracy can be observed at slow er sweep times than auto-coupled conditions. Normal
widening declines to 0.6% nominal when the Swp Time Rules key is set to Accuracy instead of Normal. The true
sweep rates cause the shape of the RBW filter displayed on the analyzer screen to widen by nominally
6%. This
bandwidth, which determines the response to impulsive signals and noise-like signals, is not affected by the
条件:nal can be digitized for further analysis or processing in the time, frequency, or modulation domain.
a. Analysis bandwidth is the instantane ous bandwidth available about a center frequency over which the input sig-
条件:–3 dB Bandwidth –7.5% relative to –4 dB bandwidth, nominal
Preselector Bandwidth Relevant to many options, such as B1X Wide IF Bandwidth, in
Bands
1 and higher. Nominal.
Mean Bandwidth at CFa Freq option ≤ 526 Freq option >
526
a. The preselector can have a signific ant passband ripple. To avoid ambiguous results, the
–4 dB bandwidth is
Range Same as Resolution Bandwidth range plus wide-open VBW (labeled
50 MHz)
in swept mode and zero spana a. For FFT processing, the selected VBW is used to determine a number of averages for FFT results. That number is chosen to give roughly equivalent display smoothing to VBW filtering in a swept measurement. For example, if
VBW = 0.1 × RBW, four FFTs are averaged to generate one result.
Preamp Off Displayed Average Noise Level to +30 dBm
RF (Option
503) Displayed Average Noise Level to +30 dBm
μW (Options 508, 513
526) Displayed Average Noise Level to +24 dBm
mmW (Options 544
550) Displayed Average Noise Level to +20 dBm
Input Attenuation Range
0 to 70 dB, in 2 dB steps
Maximum Safe Input Level Applies with or without preamp (Options P03, P08, P13, P26, P44, P50)
Average Total Power
+30 dBm (1 W)
Peak Pulse Power (≤10 μs pulse width,
≤1% duty cycle,
input attenuation ≥
30 dB)
+50 dBm (100 W)
Log Scale Ten divisions displayed
0.1 to 1.0 dB/division in 0.1 dB steps, and 1 to 20 dB/division in 1 dB steps
条件:Linear units resolution ≤1% of signal level (nominal)
Trace Averaging Off, on-screen
0.01 dB
Trace Averaging On or remote
0.001 dB
条件:(Maximum error relative to reference condition (50 MHz)
Freq Option
526 only: Modes
条件:13.5 to 16 GHz (with Option EP0)fg x ±2.0 dB ±2.7 dB ±0.55 dB
16 to 17 GHz (with Option EP0)fg x ±2.0 dB ±3.0 dB ±0.81 dB
Option 503, 508
513, or 526 (RF/μW)
20 to 30°CF u l l r a n g e
5 th Percentile (≈2σ)
3 Hz to 10 MHz x x ±0.46 dB
±0.54 dB
10 to 20 MHzd x ±0.35 dB
±0.44 dB
10 to 20 MHz x ±0.46 dB
±0.54 dB
20 to 50 MHzd x ±0.35 dB ±0.44 dB
±0.16 dB
20 to 50 MHz x ±0.35 dB ±0.44 dB
±0.19 dB
50 MHz to 3.6 GHz x ±0.35 dB ±0.44 dB
±0.16 dB
50 MHz to 3.6 GHz x ±0.35 dB ±0.47 dB
±0.15 dB
3.6 to 3.7 GHz (Band
0) x See notee
3.5 to 5.2 GHzfg x ±1.5 dB ±2.5 dB
±0.54 dB
3.5 to 5.2 GHzfg x ±1.7 dB ±3.5 dB
±0.70 dB
5.2 to 8.4 GHzfg x ±1.5 dB ±2.5 dB
±0.54 dB
5.2 to 8.4 GHzfg x ±1.5 dB ±2.5 dB
±0.57 dB
8.3 to 13.6 GHzfg x ±2.0 dB ±2.7 dB
±0.56 dB
8.3 to 13.6 GHzfg x ±2.0 dB ±2.5 dB
±0.54 dB
13.5 to 17.1 GHz (without Option EP0)fg x ±2.0 dB ±2.7 dB
±0.62 dB
条件:modes. The effect of these modes with this connector are included within these specifications.
b. See the Electronic Attenuator ( Option EA3) chapter for Frequency Response using the electronic attenuator.
within the “Absolute Amplitude Error” specifications. d. Specifications apply with DC coupling at all frequencies. With AC coupling, specifications apply at frequencies of 50 MHz and higher. Statistical observations at 10 MHz and lower show that most instruments meet the specifica- tion, but a few percent of instruments can be expected to have errors that, while within the specified limits, are
option 508, 513 or 526. Subject to these conditions, statistical observations show that performance nominally fits
Amplitude Accuracy and Range 13.5 to 17.1 GHzfg x ±2.0 dB ±2.7 dB
±0.64 dB
Frequency Response (cont.) 17.0 to 22 GHzfg x ±2.0 dB ±2.7 dB ±0.65 dB 17.0 to 22 GHzfg x ±2.0 dB ±2.8 dB ±0.72 dB 22.0 to 26.5 GHzfg x ±2.5 dB ±3.7 dB
±0.82 dB
22.0 to 26.5 GHzfg x ±2.5 dB ±3.5 dB
±0.71 dB
26.4 to 34.5 GHzfg x ±2.5 dB ±3.5 dB
±1.00 dB
34.4 to 50 GHzfg x ±3.2 dB ±4.9 dB
±1.37 dB
a. Signal frequencies above
18 GHz are prone to additional response errors due to modes in the Type-N connector
used. Only analyzers with frequency Option 526 that do not also have input connector Option C35 will have
these modes.With the use of Type-N to APC 3.5 mm adapter part number
1250-1744, there are nominally six such
c. For Sweep Type = FFT, add the RF flatness errors of this table to the IF Frequency Response errors. An additional
error source, the error in switching between swept and FFT sweep types, is nominally
±0.01 dB and is included
closer to those limits than the measurement uncertainty guardband, and thus are not warranted. The AC coupling
effect at 20 to 50 MHz is negligible, but not warranted.
e. Band 0 is extendable (set “Extend Low Band” to On) to 3.
7 GHz instead of 3.6 GHz in instruments with frequency
within the same range within the
3.6 to 3.7 GHz frequencies as within the next lower specified frequency range, but
is not warranted. f. Specifications for frequencies >3.5 GHz apply for sweep rates
≤100 MHz/ms. g. Preselector centering applied when preselector is not bypassed. Refer to Option MPB – Microwave Preselector
Bypass chapter for performance affected by bypassing the preselector.
IF Frequency Responsea Freq Option 526 only: Modes above
18 GHzb
(Demodulation and FFT response relative to the center frequency)
Preselector Max Errord Midwidth Error (95th Percentile)
Slope (dB/MHz) (95th Percentile)
条件:c. This column applies to the instantaneous analysis bandwid th in use. In the Spectrum Analyzer Mode, this would
three times better at most center frequencies. e. The “rms” nominal performance is the standard deviation of the response relative to the center frequency, inte- grated across the span. This performance measure was observed at a center frequency in each harmonic mixing band, which is representative of all center frequencies; it is not the worst case frequency.
< 3.6 ≤10 ±0.20 dB ±0.12 dB ±0.10
0.02 dB
≥ 3.6, ≤ 26.5 ≤10 On
0.23 dB
≥ 3.6, ≤ 26.5 ≤10 Offf ±0.25 dB ±0.12 dB ±0.10
0.02 dB
≥ 26.5, ≤ 50 ≤10 On
0.12 dB
> 26.5, ≤ 50 ≤10 Offf ±0.30 dB ±0.12 dB ±0.10
0.024 dB
a. The IF frequency response includes effects due to RF circuits such as input filters, that are a function of RF fre-
quency, in addition to the IF passband effects. b. Signal frequencies above 18 GHz are prone to additional response errors due to modes in the Type-N connector used. Only analyzers with frequency Option 526 that do not also have input connector Option C35 will have these modes.With the use of Type-N to APC 3.5 mm adapter part number
1250-1744, there are nominally six
such modes. These modes cause nominally up to −0.35 dB amplitude change, with phase errors of nominally up
to ±1.2°.
be the FFT width. d. The maximum error at an offset (f) from the cent er of the FFT width is given by the expression ± [Midwidth Error + (f × Slope)], but never exceeds ±Max Error. Here the Midwidth Error is the error at the center frequency for a given FFT span. Usually, the span is no larger than the FFT width in which case the center of the
FFT width is the center frequency of the analyzer. When using the Spectrum Analyzer mode with an analyzer span
is wider than the FFT width, the span is made up of multiple concatenated FFT results, and thus has multiple cen-
ters of FFT widths; in this case the f in the equation is the offset from the nearest center. Performance is nominally
IF 相位线性度 Deviation 从 mean 相位线性度
条件:Without Option EP0 With Option EP0
Freq Option 526 only: Modes above
18 GHza
条件:a linear phase condition, where the rms is computed across the span shown and over the range of center fre-
≥ 0.02, < 3.6 ≤10 n/a 0.06° 0.012° 0.17°
0.037°
≥ 3.6 ≤10 Offc 0.10° 0.022° 0.31°
0.067°
≥ 3.6 ≤10 On 0.11° 0.024° 0.83°
0.170°
a. Signal frequencies above
18 GHz are pr one to additional response errors due to modes in the Type-N connector
used. Only analyzers with frequency Option 526 that do not also have input connector Option C35 will have
these modes.With the use of Type-N to APC 3.5 mm adapter part number
1250-1744, there are nominally six
such modes. These modes cause nominally up to −0.35 dB amplitude change, with phase errors of nominally up
to ±1.2°.
b. The listed performance is the standard deviation of the phase deviation relative to the mean phase deviation from
条件:Amplitude Reference Accuracy ±0.05 dB (nominal)
subset of settings and conditions: 1 Hz ≤ RBW ≤ 1M H z ; I n p u t s i g n a l −10 to −50 dBm (details below); Input
attenuation 10 dB; span < 5 MHz (nominal additional error for span ≥ 5 MHz is 0.02 dB); all settings auto-cou-
reduce noise. When using FFT sweeps, the signal must be at the center frequency.
the conditions listed above: Scale Fidelity, Reference Level Accuracy, Display Scale Switching Uncertainty, Res-
the instrument aligns its internal gains to the 50 MHz Amplitude Reference.
scale fidelity. Our specifications and experience show no difference between signals above and below this level.
formance is not warranted at lower levels, but we fully expect it to be the same.
At 50 MHza
20 to 30°C
Full temperature range ±0.24 dB ±0.28 dB
±0.13 dB (95th percentile)
At all frequenciesa
20 to 30°C
Full temperature range ±(0.24 dB + frequency response) ±(0.28 dB + frequency response)
95th Percentile Absolute
Amplitude Accuracyb
±0.19 dB (Wide range of signal levels
RBWs, RLs, etc.
0.01 to 3.6 GHz
Preamp Onc (P03, P08, P13, P26, P44, P50) ±(0.36 dB + frequency response) a. Absolute amplitude accuracy is the total of all ampl itude measurement errors, and applies over the following
pled except Swp Time Rules = Accuracy; combinations of low signal level and wide RBW use VBW ≤
30 kHz to
This absolute amplitude accuracy specification includes the sum of the following individual specifications under
olution Bandwidth Switching Uncertainty
50 MHz Amplitude Reference Accuracy, and the accuracy with which
The only difference between signals within the range above
–50 dBm and those signals below that level is the
The only reason our Absolute Amplitude Uncertainty specification does not go below this level is that noise
detracts from our ability to verify the performance at all levels with acceptable test times and yields. So the per-
条件:Amplitude Accuracy and Range b. Absolute Amplitude Accuracy for a wide range of signal and measurement settings, covers the 95th percentile proportion with 95% confidence. Here are the details of what is covered and how the computation is made:
The wide range of conditions of RBW, signal level, VBW, reference level and display scale are discussed in foot-
note a. There are 44 quasi-random combinations used, tested at a
50 MHz signal frequency. We compute the
95th percentile proportion with 95% confidence for this set observed over a statistically significant number of
instruments. Also, the frequency response relative to the
50 MHz response is characterized by varying the signal
across a large number of quasi-random verification frequencies that are chosen to not correspond with the fre-
quency response adjustment frequencies. We again compute the
95th percentile proportion with 95% confi-
dence for this set observed over a statistically significant number of instruments. We also compute the
95th
percentile accuracy of tracing the calibration of the
50 MHz absolute amplitude accuracy to a national stan-
dards organization. We also compute the 95th percentile accuracy of tracing the calibration of the relative fre-
quency response to a national standards organization. We take the root-sum-square of these four independent
Gaussian parameters. To that rss we add the environmental effects of temperature variations across the
20 to
30°C range. These computations and measurements are made with the mechanical attenuator only in circuit,
set to the reference state of 10 dB.
A similar process is used for computing the result when using the electronic attenuator under a wide range of
settings: all even settings from 4 through 24 dB inclusive, with the mechanical attenuator set to 10 dB. The
95th
percentile result was
0.21 dB.
c. Same settings as footnote a, except that the signal level at the preamp input is
−40 to −80 dBm. Total power at
preamp (dBm) = total power at input (dBm) minus input attenuation (dB). This specification applies for signal
frequencies above
100 kHz.
条件:Attenuation 0 dB ±0.05 dB (nominal)
3 Hz to 3.6 GHz ±0.3 dB (nominal)
3.5 to 8.4 GHz ±0.5 dB (nominal)
8.3 to 13.6 GHz ±0.7 dB (nominal)
13.5 to 26.5 GHz ±0.7 dB (nominal)
26.5 to 50.0 GHz ±1.0 dB (nominal)
Input Attenuation Switching Uncertainty Refer to the footnote for
(Relative to 10 dB (reference setting)
50 MHz (reference frequency), preamp off
Attenuation 12 to 40 dB ±0.14 dB
±0.04 dB (typical)
Attenuation 2 to 8 dB, or > 40 dB ±0.18 dB
±0.06 dB (typical)
Attenuation >
2 dB, preamp off
条件:10 dB atten, 50 MHz (ref condition) x 1.07:1 (nominal)
10 dB atten, 50 MHz (ref condition) x 1.09:1 (nominal)
0 dB atten, 0.01 to 3.6 GHz x x < 2.2:1 (nominal)
Nominal VSWR vs. Freq, 10 dB See plots following
RF Input VSWR (at tuned frequency, DC coupled) mmW (Option
544, or 550)
RF/μW (Option 503, 508
513, or 526)
95th Percentilea
Band 0 (0.01 to 3.6 GHz, 10 dB atten) x
1.139
Band 0 (0.01 to 3.6 GHz, 10 dB atten) x
1.134
Band 1 (3.5 to 8.4 GHz, 10 dB atten) x
1.290
Band 1 (3.5 to 8.4 GHz, 10 dB atten) x
1.152
Band 2 (8.3 to 13.6 GHz, 10 dB atten) x
1.388
Band 2 (8.3 to 13.6 GHz, 10 dB atten) x
1.178
Band 3 (13.5 to 17.1 GHz, 10 dB atten) x
1.41
Band 3 (13.5 to 17.1 GHz, 10 dB atten) x
1.212
Band 4 (17.0 to 26.5 GHz, 10 dB atten) x
1.48
Band 4 (17.0 to 26.5 GHz, 10 dB atten) x
1.331
Band 5 (26.4 to 34.5 GHz, 10 dB atten) x
1.373
Band 6 (34.4 to 50 GHz, 10 dB atten) x
1.389
Atten > 10 dB Similar to atten =
10 dB
RF Calibrator (e.g.
50 MHz) is On Open input
条件:VSWR information and the Rayleigh model (Case C or E in the application note) with that process.
Amplitude Accuracy and Range a. X-Series analyzers have a reflection coefficient that is excellently modeled with a Rayleigh probability distribu- tion. Keysight recommends using the methods outlined in Application Note
1449-3 and companion Average
Power Sensor Measurement Uncertainty Calculator to compute mismatch uncertainty. Use this
95th percentile
条件:also have option FS1 installed. Otherwise, the maximum RBW setting is 8 MHz.
Resolution Bandwidth Switching Uncertainty Relative to reference BW of 30 kHz,
verified in low banda 1.0 Hz to 1.5 MHz RBW ±0.03 dB 1.6 MHz to 2.7 MHz RBW ±0.05 dB 3.0 MHz RBW
±0.10 dB
Manually selected wide RBWs: 4, 5, 6, 8, 10 MHzb
±0.30 dB
a. RBW switching uncertainty is verified at 50 MHz. It is consistent for all measurements made without the prese-
lector, thus in Band 0 and also in higher bands with the Preselector Bypass option. In preselected bands, the
slope of the preselector passband can interact with the RBW shape to make an apparent additional RBW
switching uncertainty of nominally
±0.05 dB/MHz times the RBW.
b. The
10 MHz RBW setting is only available on analyzers with instrument software version ≥ A.30.05 and which
Log Units
−170 to +30 dBm, in 0.01 dB steps
Linear Units
707 pV to 7.07 V, with 0.01 dB resolution (0.11%)
a. Because reference level affects only the display, not the measurement, it causes no additional error in measure-
Switching between Linear and Log
0 dBa
a. Because Log/Lin and Log Scale Switching affect only th e display, not the measurement, they cause no addi-
tional error in measurement results from trace data or markers.
条件:Absolute Log-Linear Fidelity (Relative to the reference condition: −25 dBm input through 10 dB attenuation, thus
−35 dBm at the input mixer)
−18 dBm ≤ ML ≤ −10 dBm ±0.10 dB
±0.04 dB
ML < −18 dBm ±0.07 dB
±0.02 dB
Relative Fidelityd Applies for mixer levelc range from −10 to
−80 dBm, mechanical attenuator only,
条件:Sum of the following terms: Nominal high level term Up to ±0.015 dBe instability term 0.0019 dBrmsf slope term From equationg
due to noise can be estimated from the equation below, given for the 3-sigma (three standard deviations) level.
ear relative scale fidelity, but increase DANL by 0.63 dB instead of 0.28 dB.
c. Mixer level = Input Level − Input Attenuation d. The relative fidelity is the error in the measured difference between two signal levels. It is so small in many cases that it cannot be verified without being dominated by measurement uncertainty of the verification. Because of this verification difficulty, this specification gives nominal performance, based on numbers that are as conserva-
equation to compute the nominal performance.
filter term applies and evaluates to the limit of ±0.005 dB. The sum of all these terms is ±0.037 dB.
prefilter term Up to ±0.005 dBh
a. Supplemental information: The amplitude detection linearity specification applies at all levels below
−10 dBm at
the input mixer; however, noise will reduce the accuracy of low level measurements. The amplitude error due to
noise is determined by the signal-to-noise ratio, S/N. If the S/N is large (20 dB or better), the amplitude error
The errors due to S/N ratio can be further reduced by averaging results. For large S/N (20 dB or better), the
3-sigma level can be reduced proportional to the square root of the number of averages taken.
b. The scale fidelity is warranted with ADC dither set to Medium. Dither increases the noise level by nominally only
0.28 dB for the most sensitive case (preamp Off, best DANL frequencies). With dither Off, scale fidelity for low
level signals, around −60 dBm or lower, will nominally degrade by
0.2 dB. Dither High will give exceptional lin-
tively determined as those used in warranted specifications. We will consider one example of the use of the error
Example: the accuracy of the relative level of a sideband around
−60 dBm, with a carrier at −5d B m , u s i n g a t t e n -
uation = 10 dB, RBW =
3 kHz, evaluated with swept analysis. The high level term is evaluated with P1 =
−15 dBm and P2 = −70 dBm at the mixer. This gives a maximum error within
±0.008 dB. The instability term is
±0.0019 dB if the measurement is completed within a minute. The slope term evaluates to ±0.022 dB. The pre-
3σ 32 0 dB() 11 0 SN⁄ 3dB+()
20dB⁄()–+log=
条件:the highest power for which linearity is specified). All these levels are referred to the mixer level.
Amplitude Accuracy and Range e. Errors at high mixer levels will nominally be well within the range of ±0.015 dB × {exp[(P1 − Pref)/(8.69 dB)] − exp[(P2 − Pref)/(8.69 dB)]} (exp is the natural exponent function, e x). In this expression, P1 and P2 are the pow- ers of the two signals, in decibel units, whose relative power is being measured. Pref is
−10 dBm (−10 dBm is
f. The stability of the analyzer gain can be an error term of importance when no settings have changed. These have
been studied carefully in the PXA. One source of instability is the variation in analyzer response with time when
fully warmed up in a stable lab environment. This has been observed to be well modeled as a random walk pro-
cess, where the difference in two measurements spaced by time t is given by a × sqrt(t), where a is
0.0019 dBrms per root minute. The other source of instability is updated alignments from running full or partial
alignments in the background or invoking an alignment. Invoked alignments (Align Now, All) have a standard
deviation of 0.0018 dB, and performing these will restart the random walk behavior. Partial alignments (Auto
Align set to "Partial") have a standard deviation that is, coincidentally, also
0.0018 dBrms, and only occurs once
every ten minutes. The standard deviation from full background alignment (Auto Align set to "Normal") is
0.015
dBrms; with these alignments on, there is no additional random walk behavior. (Keysight recommends setting
alignments (Auto Align) to Normal in order to make the best measurements over long periods of time or in envi-
ronments without very high temperature stability. For short term measurements in highly stable environments,
setting alignments to Partial can give the best stability. Setting Alignments to Off is not recommended where
stability matters.) g. Slope error will nominally be well within the range of ±0.0004 × (P1 − P2). P1 and P2 are defined in footnote e. h. A small additional error is possible. In FFT sweeps, th is error is possible for spans under
4.01 kHz. For non-FFT measurements, it is possible for RBWs of 3.9 kHz or less. The error is well within the range of ±0.0021 × (P1 -
P2) subject to a maximum of ±0.005 dB. (The maximum dominates for all but very small differences.) P1 and P2
Description Specifications Supplemental Information
1 dB Gain Compression Point (Two-tone)abc a. Large signals, even at frequencies not shown on the screen, can cause the analyzer to incorrectly measure on-screen signals because of two-tone gain compression. This specification tells how large an interfering signal
must be in order to cause a
1 dB change in an on-screen signal.
b. Specified at 1 kHz RBW with 100 kHz tone spacing. The compression point will nominally equal the specification
for tone spacing greater than
5 times the prefilter bandwidth. At smaller spacings, ADC clipping may occur at a
level lower than the
1 dB compression point.
Maximum power at mixerd 20 to 30°C Full range 20 to 40 MHz −3 dBm −4 dBm 0 dBm (typical) 40 to 200 MHz +1 dBm −1 dBm
+3 dBm (typical)
200 MHz to 3.6 GHz +3 dBm +2 dBm
+5 dBm (typical)
3.6 to 16 GHz +1 dBm 0 dBm
+4 dBm (typical)
16 to 26.5 GHz −1 dBm −3 dBm
+2 dBm (typical)
26.5 to 50 GHz
0 dBm (nominal)
Clipping (ADC Over-range)
Any signal offset
−10 dBm Low frequency exceptionse
Signal offset >
5 times IF prefilter bandwidth and IF
+12 dBm (nominal)
–3 dB Bandwidth
≤ 3.9 kHz < 4.01 kHz
8.9 kHz
4.3 to 27 kHz < 28.81 kHz
79 kHz
30 to 160 kHz < 167.4 kHz
303 kHz
180 to 390 kHz < 411.9 kHz
966 kHz
430 kHz to 10 MHzg < 7.99 MHz
10.9 MHz
条件:quency) at the ADC. f. This table a pplies without Option FS1 or FS2, fast sweep. With Option FS1or FS2, this table applies for sweep rates that are manually chosen to be the same as or slower than "traditional" sweep rates, instead of the much faster sweep rates, such as autocoupled sweep rates, available with FS1 or FS2. Sweep rate is defined to
also have option FS1 installed. Otherwise, the maximum RBW setting is 8 MHz.
Dynamic Range c. Reference level and off-screen performance: The referenc e level (RL) behavior differs from some earlier analyz- ers in a way that makes this analyzer more flexible. In other analyzers, the RL controlled how the measurement was performed as well as how it was displayed. Because the logarithmic amplifier in these analyzers had both
range and resolution limitations, this behavior was necessary for optimum measurement accuracy. The logarith-
mic amplifier in this signal analyzer, however, is implemented digitally such that the range and resolution greatly
exceed other instrument limitations. Because of this, the analyzer can make measurements largely independent
of the setting of the RL without compromising accuracy. Because the RL becomes a display function, not a mea-
surement function, a marker can read out results that are off-screen, either above or below, without any change
in accuracy. The only exception to the independence of RL and the way in which the measurement is performed
is in the input attenuation setting: When the input attenuation is set to auto, the rules for the determination of
the input attenuation include dependence on the reference level. Because the input attenuation setting controls
the tradeoff between large signal behaviors (third-order intermodulation, compression, and display scale fidel-
ity) and small signal effects (noise), the measurement results can change with RL changes when the input atten-
uation is set to auto. d. Mixer power level (dBm) = input power (dBm) − input attenuation (dB). e. The ADC clipping level declines at low frequencies (bel ow 50 MHz) when the LO feedthrough (the signal that appears at 0 Hz) is within 5 times the prefilter bandwidth (see table) and must be handled by the ADC. For
example, with a
300 kHz RBW and prefilter bandwidth at 966 kHz, the clipping level reduces for signal frequen-
cies below 4.83 MHz. For signal frequencies below
2.5 times the prefilter bandwidth, there will be additional
reduction due to the presence of the image signal (the signal that appears at the negative of the input signal fre-
be span divided by sweep time. If the sweep rate is ≤
1.1 times RBW-squared, the table applies. Otherwise
compute an "effective RBW" = Span / (SweepTime × RBW). To determine the IF Prefilter Bandwidth, look up
this effective RBW in the table instead of the actual RBW. For example, for RBW = 3 kHz, Span =
300 kHz, and
Sweep time = 42 ms, we compute that Sweep Rate = 7.1 MHz/s, while RBW-squared is
9 MHz/s. So the Sweep
Rate is < 1.1 times RBW-squared and the table applies; row 1 shows the IF Prefilter Bandwidth is nominally
8.9
kHz. If the sweep time is
1 ms, then the effective RBW computes to 100 kHz. This would result in an IF Prefilter
Bandwidth from the third row, nominally
303 kHz.
g. The
10 MHz RBW setting is only available on analyzers with instrument software version ≥ A.30.05 and which
DANL(不含) 噪声底 Extension 和(不含)
Option EP0a
Averaging type = Log
0 dB input attenuation
IF Gain = High
1 Hz Resolution Bandwidth
Refer to the footnote for
条件:3 to 10 Hz x x x –100 dBm (nominal)
10 to 100 Hz x x x –125 dBm (nominal)
100 Hz to 1 kHz x x x –130 dBm (nominal)
1 to 9 kHz x x x –145 dBm (nominal)
Band Overlaps on page 21. mmW with no signal path optionsb mmW with one or more signal path optionsc
RF/μW without Option EP0
20 to 30°C Full range Typical
9 to 100 kHz x x x −146 dBm −146 dBm
−151 dBm
100 kHz to 1 MHz x x x −150 dBm −150 dBm
−156 dBm
1 to 10 MHzd x x x −155 dBm −152 dBm
−158 dBm
10 MHz to 1.2 GHz x x x −154 dBm −152 dBm
−155 dBm
1.2 to 2.1 GHz x x x −153 dBm −152 dBm
−155 dBm
2.1 to 3 GHz x x x −151 dBm −150 dBm
−153 dBm
3.0 to 3.6 GHz x x x −151 dBm −149 dBm
−153 dBm
3.5 to 4.2 GHz x −147 dBm −146 dBm
−150 dBm
3.5 to 4.2 GHz x −143 dBm −141 dBm
−147 dBm
3.5 to 4.2 GHz x –145 dBm –143 dBm
–148 dBm
4.2 to 8.4 GHz x −150 dBm −148 dBm
−152 dBm
4.2 to 6.6 GHz x −144 dBm −142 dBm
−148 dBm
4.2 to 6.6 GHz x –146 dBm –144 dBm
–149 dBm
6.6 to 8.4 GHz x −147 dBm −145 dBm
−149 dBm
6.6 to 8.4 GHz x –149 dBm –147 dBm
–151 dBm
8.3 to 13.6 GHz x −149 dBm −147 dBm
−151 dBm
8.3 to 13.6 GHz x −147 dBm −145 dBm
−149 dBm
条件:Additional DANL, IF Gain = Lowe x x x –164.5 dBm (nominal)
because the noise figure does not depend on RBW and 1 kHz measurements are faster.
Dynamic Range 8.3 to 13.6 GHz x −149 dBm −147 dBm −151 dBm 13.5 to 16.9 GHz x −145 dBm −143 dBm −147 dBm 13.5 to 14 GHz x −143 dBm −141 dBm
−146 dBm
13.5 to 14 GHz x −145 dBm −143 dBm
−148 dBm
14 to 17 GHz x −145 dBm −143 dBm
−148 dBm
14 to 17 GHz x −147 dBm −145 dBm
−150 dBm
16.9 to 20 GHz x -143 dBm -140 dBm
-145 dBm
17.0 to 22.5 GHz x −141 dBm −139 dBm
−146 dBm
17.0 to 22.5 GHz x −145 dBm −143 dBm
−148 dBm
20.0 to 26.5 GHz x −137 dBm −135 dBm
−140 dBm
22.5 to 26.5 GHz x −139 dBm −137 dBm
−143 dBm
22.5 to 26.5 GHz x −142 dBm −140 dBm
−145 dBm
26.4 to 30 GHz x −138 dBm −136 dBm
−142 dBm
26.4 to 30 GHz x −141 dBm −139 dBm
−145 dBm
30 to 34 GHz x −138 dBm −135 dBm
−142 dBm
30 to 34 GHz x −141 dBm −138 dBm
−144 dBm
33.9 to 37 GHz x −134 dBm −131 dBm
−139 dBm
33.9 to 37 GHz x −137 dBm −133 dBm
−142 dBm
37 to 40 GHz x −132 dBm −129 dBm
−138 dBm
37 to 40 GHz x −136 dBm −133 dBm
−141 dBm
40 to 49 GHz x −130 dBm −126 dBm
−135 dBm
40 to 46 GHz x −136 dBm −132 dBm
−140 dBm
46 to 49 GHz x −133 dBm −129 dBm
−138 dBm
49 to 50 GHz x −128 dBm −124 dBm
−133 dBm
49 to 50 GHz x −133 dBm −129 dBm
−137 dBm
a. DANL for zero span and swept is measured in a
1 kHz RBW and normalized to the narrowest available RBW
b. Specifications marked with an x in this column apply to analyzers with mmW frequency options (Option
544 or
550) and none of the following options that affect the signal path: MPB, LNP, B85, B1X, B2X, or B5X.
c. Specifications marked with an x in this column apply to analyzers with mmW frequency options (Option
544 or
550) and one or more of the following options that affect the signal path: MPB, LNP, B85, B1X.
条件:Dynamic Range d. DANL below 10 MHz is affected by phase noise around th e LO feedthrough signal. Specifications apply with the best setting of the Phase Noise Optimization control, which is to choose the “Best Close-in φ Noise" for frequen- cies below about 150 kHz, and “Best Wide Offset φ Noise" for frequencies above about 150 kHz.
can be set to autorange, where it varies with the input signal level, in addition to forced High and Low settings.
e. Setting the IF Gain to Low is often desirable in order to allow higher power into the mixer without overload, better
compression and better third-order intermodulation. When the Swept IF Gain is set to Low, either by auto cou-
pling or manual coupling, there is noise added above that specified in this table for the IF Gain = High case. That
excess noise appears as an additional noise at the input mixer. This level has sub-decibel dependence on center
frequency. To find the total displayed average noise at the mixer for Swept IF Gain = Low, sum the powers of the
DANL for IF Gain = High with this additional DANL. To do that summation, compute DANLtotal =
10 × log
(10(DANLhigh/10) + 10(AdditionalDANL / 10)). In FFT sweeps, the same behavior occurs, except that FFT IF Gain
DANL(不含) 噪声底 Extension,(含)
Option EP0a
Averaging type = Log
0 dB input attenuation
IF Gain = High
1 Hz Resolution Bandwidth
Refer to the footnote for
条件:Band Overlaps on page 21. mmW with Option EP0
3 to 10 Hz x –100 dBm (nominal)
10 to 100 Hz x –125 dBm (nominal)
100 Hz to 1 kHz x –130 dBm (nominal)
10 to 100 Hz x –114 dBm (nominal)
100 Hz to 1 kHz x –128 dBm (nominal)
1 to 9 kHz x –136 dBm (nominal)
RF/μW with Option EP0
20 to 30°CF u l l r a n g e T y p i c a l
1 to 9 kHz x
–137dBm (nominal)
3 to 10 Hz x
–95 dBm (nominal)
9 to 100 kHz x −143 dBm −143 dBm
−144 dBm
100 kHz to 1 MHz x −150 dBm −150 dBm
−153 dBm
1 to 10 MHzb x −155 dBm −152 dBm
−156 dBm
10 MHz to 1.2 GHz x −154 dBm −152 dBm
−155 dBm
1.2 to 2.1 GHz x −152 dBm −151 dBm
−153 dBm
2.1 to 3 GHz x −151 dBm −150 dBm
−152 dBm
3.0 to 3.6 GHz x −150 dBm −149 dBm
−151 dBm
9 to 100 kHz x −141 dBm −141 dBm
−145 dBm
100 kHz to 1 MHz x −150 dBm −150 dBm
−154 dBm
1 to 10 MHzc x −155 dBm −152 dBm
−156 dBm
10 MHz to 1.2 GHz x −154 dBm −153 dBm
−155 dBm
1.2 to 2.1 GHz x −152 dBm −151 dBm
−153 dBm
2.1 to 3 GHz x −151 dBm −149 dBm
−152 dBm
3.0 to 3.6 GHz x −150 dBm −148 dBm
−151 dBm
3.5 to 4.2 GHz x −147 dBm −146 dBm
−150 dBm
3.5 to 4.2 GHz x −143 dBm −141 dBm
−147 dBm
条件:Additional DANL, IF Gain = Lowd x x –164.5 dBm (nominal)
because the noise figure does not depend on RBW and 1 kHz measurements are faster.
b. DANL below 10 MHz is affected by phase noise around th e LO feedthrough signal. Specifications apply with the
cies below about 150 kHz, and “Best Wide Offset φ Noise" for frequencies above about 150 kHz.
c. DANL below 10 MHz is affected by phase noise around th e LO feedthrough signal. Specifications apply with the
cies below about 150 kHz, and “Best Wide Offset φ Noise" for frequencies above about 150 kHz.
can be set to autorange, where it varies with the input signal level, in addition to forced High and Low settings.
Dynamic Range 4.2 to 8.4 GHz x −150 dBm −148 dBm −152 dBm 4.2 to 6.6 GHz x −144 dBm −142 dBm −148 dBm 6.6 to 8.4 GHz x −147 dBm −145 dBm
−148 dBm
8.3 to 13.6 GHz x −147 dBm −145 dBm
−148 dBm
8.3 to 13.6 GHz x −147 dBm −146 dBm
−149 dBm
13.5 to 16.9 GHz x −145 dBm −143 dBm
−147 dBm
13.5 to 14 GHz x −143 dBm −141dBm
−146 dBm
14 to 17 GHz x −145 dBm −143dBm
−148 dBm
17 to 22.5 GHz x −141 dBm −139 dBm
−145 dBm
16.9 to 20 GHz x -143 dBm -140 dBm
-145 dBm
20.0 to 26.5 GHz x −135 dBm −133 dBm
−138 dBm
22.5 to 26.5 GHz x −139 dBm −137 dBm
−142 dBm
26.4 to 30 GHz x −138 dBm −136 dBm
−142 dBm
30 to 34 GHz x −138 dBm −135 dBm
−142 dBm
33.9 to 37 GHz x −134 dBm −131 dBm
−139 dBm
37 to 40 GHz x −132 dBm −129 dBm
−138 dBm
40 to 49 GHz x −130 dBm −126 dBm
−134 dBm
49 to 50 GHz x −128 dBm −124 dBm
−133 dBm
a. DANL for zero span and swept is measured in a
1 kHz RBW and normalized to the narrowest available RBW
best setting of the Phase Noise Optimization control, which is to choose the “Best Close-in φ Noise" for frequen-
best setting of the Phase Noise Optimization control, which is to choose the “Best Close-in φ Noise" for frequen-
d. Setting the IF Gain to Low is often desirable in order to allow higher power into the mixer without overload, better
compression and better third-order intermodulation. When the Swept IF Gain is set to Low, either by auto cou-
pling or manual coupling, there is noise added above that specified in this table for the IF Gain = High case. That
excess noise appears as an additional noise at the input mixer. This level has sub-decibel dependence on center
frequency. To find the total displayed average noise at the mixer for Swept IF Gain = Low, sum the powers of the
DANL for IF Gain = High with this additional DANL. To do that summation, compute DANLtotal =
10 × log
(10(DANLhigh/10) + 10(AdditionalDANL / 10)). In FFT sweeps, the same behavior occurs, except that FFT IF Gain
条件:Improvement for CW Signalsg 3.5 dB (nominal)
Improvement, Pulsed-RF Signalsh 10.8 dB (nominal)
Improvement, Noise-Like Signals 9.1 dB (nominal)
Extension Improvementa mmW with no signal path optionsb mmW with one or more signal path optionsc
95th Percentile (≈2σ)d
RF/μW (Option 503, 508, 513,or
526) Preamp Off Preamp On e
Band 0, f > 20 MHzf x 9 dB
10 dB
Band 0, f > 20 MHzf ×10 dB
9 dB
Band 0, f > 20 MHzf ×10 dB
9 dB
条件:Dynamic Range a. This statement on the improvement in DANL is based on the statistical observations of the error in the effective noise floor after NFE is applied. That effective noise floor can be a negative or a positive power at any frequency.
These 95th percentile values are based on the absolute value of that effective remainder noise power.
operation after the first time the analyzer has been installed in the environment, and given an hour to stabilize.
noise level with the actual source impedance is greatly multiplied in a decibel sense.
frequencies between 0.5 and 20 MHz the NFE effectiveness increases from nearly none to near its maximum.
improved by using NFE. The nominal improvement shown was evaluated for a 2 dB error with 250 traces averaged.
DANL sections of this table. h. Pulsed-RF signals are usually measured with peak detectio n. Often, they are also measured with many “max hold” traces. When the measurement time in each display point is long compared to the reciprocal of the RBW, or the number of traces max held is large, considerable variance reduction occurs in each measurement point. When the
b. Specifications marked with an x in this column apply to analyzers with mmW frequency options (Option
544 or
550) and none of the following options that affect the signal path: MPB, LNP , B85, B1X, B2X or B5X.
c. Specifications marked with an x in this column apply to analyzers with mmW frequency options (Option
544 or
550) and one or more of the following options that affect the signal path: MPB, LNP , B85, B1X, B2X or B5X.
d. Unlike other 95th percentiles, these table values do no t include delta environment effects. NFE is aligned in the
factory at room temperature. For best performance, in an environment that is different from room temperature,
such as an equipment rack with other instruments, we recommend running the "Characterize Noise Floor"
e. DANL of the preamp is specified with a
50 Ω source impedance. Like all amplifiers, the noise varies with the source
impedance. When NFE compensates for the noise with an ideal source impedance, the variation in the remaining
f. NFE does not apply to the low frequency sensitivity. At frequencies below about
0.5 MHz, the sensitivity is domi-
nated by phase noise surrounding the LO feedthrough. The NFE is not designed to improve that performance. At
g. Improvement in the uncertainty of measurement due to am plitude errors and variance of the results is modestly
For extreme numbers of averages, the result will be as shown in the "Improvement for Noise-like Signals" and
variance reduction is large, NFE can be quite effective; when it is small, NFE has low effectiveness. For example, in
Band 0 with 100 pulses per trace element, in order to keep the error within ±3 dB error
95% of the time, the signal
can be
10.8 dB lower with NFE than without NFE.
Displayed Average Noise Level with Noise Floor Extensiona mmW with no signal path optionsb mmW with one or more signal path optionsc
RF/μW (Option 503, 508, 513, or 526)
95th Percentile (≈2σ)b
条件:noise floor after NFE is applied. That effective noise floor can be a negative or a positive power at any frequency.
These 95th percentile values are based on the absolute value of that effective remainder noise power.
operation after the first time the analyzer has been installed in the environment, and given an hour to stabilize.
Band 0, f > 20 MHzf xxx −163 dBm
−174 dBm
Band 1 x −162 dBm
−174 dBm
Band 1 x −159 dBm
−172 dBm
Band 1 x −160 dBm
−172 dBm
Band 2 x −162 dBm
−173 dBm
Band 2 x −159 dBm
−172 dBm
Band 2 x −161 dBm
−173 dBm
Band 3 x −156 dBm
−172 dBm
Band 3 x −159 dBm
−173 dBm
Band 3 x −161 dBm
−174 dBm
Band 4 x −150 dBm
−166 dBm
Band 4 x −154 dBm
−169 dBm
Band 4 x −158 dBm
−171 dBm
Band 5 x −153 dBm
−167 dBm
Band 5 x −157 dBm
−168 dBm
Band 6 x −144 dBm
−158 dBm
Band 6 x −149 dBm
−161 dBm
a. DANL with NFE is unlike DANL without NFE. It is based on the statistical observations of the error in the effective
b. Unlike other 95th percentiles, these table values do no t include delta environment effects. NFE is aligned in the
factory at room temperature. For best performance, in an environment that is different from room temperature,
such as an equipment rack with other instruments, we recommend running the "Characterize Noise Floor"
条件:Dynamic Range c. NFE performance can give results below theoretical levels of noise in a termination resistor at room temperature, about –174 dBm/Hz. this is intentional and usually desirable. NFE is not designed to report the noise at the input of the analyzer; it reports how much more noise is at the input of the analyzer than was present in its alignment.
lower than the noise density (power averaged) in a 1 Hz noise bandwidth.
And its alignment includes the noise of a termination at room temperature. So it can often see the added noise
below the theoretical noise. Furthermore, DANL is defined with log averaging in a 1 Hz RBW, which is about
2.3 dB
Spurious Responses: Residual and Image (see Band Overlaps on page
21)
条件:Attenuation + Preamp Gain b. Where the presence of Option EP0 affects the performance, it is noted with "(EP0)" text.
Zero span or FFT or other frequencies c. Input terminated, 0 dB input attenuation.
Option EP0 effectsb
a. The spurious response specifications only apply with th e preamp turned off. When the preamp is turned on, per-
formance is nominally the same as long as the mixer level is interpreted to be: Mixer Level = Input Level − Input
Residual Responsesc
200 kHz to 8.4 GHz (swept)
−100 dBm
−100 dBm
Response Response (typical)
条件:(nominal) 26.5 to 34.5 GHz f+645 MHz −30 dBm –70 dBc –94 dBc 34.4 to 42 GHz f+645 MHz −30 dBm –59 dBc –79 dBc
RF/μWm m W R F / μW mmW 10 MHz to 26.5 GHz f+45 MHz −10 dBm −80 dBc −80 dBc
−118 dBc
−105 dBc (EP0)
−118 dBc
−117 dBc (EP0)
10 MHz to 3.6 GHz f+10245 MHz −10 dBm −80 dBc −80 dBc
−112 dBc
−106 dBc (EP0)
−112 dBc
−104 dBc (EP0)
10 MHz to 3.6 GHz f+645 MHz −10 dBm −80 dBc −80 dBc −101 dBc
−101 dBc
3.5 to 13.6 GHz f+645 MHz −10 dBm −78 dBce −80 dBc −87 dBc
−102 dBc
13.5 to 17.1 GHz f+645 MHz −10 dBm −74 dBc −80 dBc −84 dBc
−102 dBc
17.0 to 22 GHz f+645 MHz −10 dBm −70 dBc −80 dBc −82 dBc
−100 dBc
22 to 26.5 GHz f+645 MHz −10 dBm −68 dBc −70 dBc
−79 dBc
−75 dBc (EP0)
−97 dBc
−90 dBc (EP0)
26.5 to 50 GHz f+45 MHz −30 dBm
–90 dBc
−76 dBc (EP0)
42 to 50 GHz f+645 MHz −30 dBm
–75 dBc
Dynamic Range e. We also support the following additional spurious responses specifications from 8 to 12 GHz at 20 to 30º C. Image responses are warranted to be better than –82 dBc, with 95th percentile performance of –88.3 dBc. LO-related spurious responses are warranted to be better than
–83 dBc at 1 to 10 MHz offsets from the carrier, with phase
Mixer Levela Response Response (typical)
First RF Orderb (f ≥
10 MHz from carrier)
Carrier Frequency ≤ 26.5 GHz −10 dBm −80 dBc +
20 × log(Nc) Includes IF feedthrough, LO
harmonic mixing responses
条件:Carrier Frequency > 26.5 GHz −30 dBm –90 dBc (nominal)
Higher RF Orderd (f ≥
10 MHz from carrier)
Carrier Frequency ≤ 26.5 GHz −40 dBm −80 dBc +
20 × log(Nc) Includes higher order mixer
条件:Carrier Frequency > 26.5 GHze −30 dBm −90 dBc (nominal)
(nominal) a. Mixer Level = Input Level − Input Attenuation. b. With first RF order spurious products, the indicated freq uency will change at the same rate as the input, with higher order, the indicated frequency will change at a rate faster than the input.
c. N is the LO multiplication factor. d. RBW=100 Hz. With higher RF order spurious responses, th e observed frequency will change at a rate faster than the input frequency. e. Nominally −40 dBc under large magnetic (0.38 Gauss rms) or vibrational (0.21 g rms) environmental stimuli.
f. We also support the following additional spurious respon ses specifications from 8 to 12 GHz at 20 to 30º C.
Image responses are warranted to be better than –82 dBc, with 95th percentile performance of –88.3 dBc.
LO-Related Spurious Responses (Offset from carrier
200 Hz to 10 MHz)
−10 dBm −68 dBcfe+ 20 × log(Nc) −72 dBc +
20 × log(Nc) (typical)
Close-in Sidebands Spurious Response (LO Related, offset <
200 MHz)
LO-related spurious responses are warranted to be better than
–83 dBc at 1 to 10 MHz offsets from the carrier
Second Harmonic Distortion mmW (Option
544, or 550)
RF/μW (Option 503, 508
513, or 526)
Levela. Mixer 电平 = 输入电平 − 输入衰减
条件:Distortion SHIbc b. SHI = second harmonic intercept. The SHI is given by th e mixer power in dBm minus the second harmonic distor- tion level relative to the mixer tone in dBc. c. Performance >3.6 GHz improves greatly with Option LNP enabled. See Option LNP - Low Noise Path
Specifications on page
225.
条件:Source Frequency 0 to 100 MHz x x –15 dBm –57 dBc +42 dBm 0.1 to 1.8 GHzd d. These frequencies are half of the band edge frequencies. See Band Overlaps on page 21.
x x –15 dBm –60 dBc
+45 dBm
1.75d to 3 GHz x –15 dBm –77 dBc
+62 dBm
1.75 to 3 GHz x –15 dBm –72 dBc
+57 dBm
3 to 6.5 GHz x x −15 dBm –77 dBc
+62 dBm
6.5 to 10 GHz x x −15 dBm –70 dBc
+55 dBm
10 to 13.25 GHz x x −15 dBm –62 dBc
+47 dBm
13.2 to 25 GHz x −15 dBm −65 dBc
+50 dBm
Intermodulation (Tone separation >
5 times IF
Refer to the footnote for
Refer to footnoted for the "Extrapolated
Distortion". mmW Option
544, or 550
RF/μW Option 503, 508
513, or 526
20 to 30°C Intercepte Intercept (typical)
10 to 150 MHz x x +13 dBm
+16 dBm
150 to 600 MHzf x x +17 dBm
+20 dBm
600 MHz to 1.1 GHz x x +19 dBm
+21 dBm
1.1 to 3.6 GHzg x x +19.5 dBm
+22 dBm
3.5 to 8.4 GHz x +17 dBm
+23 dBm
3.6 to 3.7 GHz (Band
0) x See note h
3.5 to 8.4 GHz x +16 dBm
+23 dBm
8.3 to 13.6 GHz x +17 dBm
+23 dBm
8.3 to 13.6 GHz x +16 dBm
+23 dBm
13.5 to 17.1 GHz x +15 dBm
+20 dBm
13.5 to 17.1 GHz x +13 dBm
+17 dBm
17.0 to 26.5 GHzi x +16 dBm
+22 dBm
17.0 to 26.5 GHzi x +13 dBm
+20 dBm
26.4 to 34.5 GHz x +13 dBm
+18 dBm
34.4 to 50 GHzg x +10 dBm
+15 dBm
Full temperature range 10 to 150 MHz x x +12 dBm 150 to 600 MHzj x x
+16 dBm
Dynamic Range 600 MHz to 1.1 GHz x x +17 dBm 1.1 to 3.6 GHzk x x+ 1 7 .
5 d B m
Third Order Intermodulation
条件:tion condition is met, the effect on TOI of the setting of IF Gain is negligible. TOI is verified with IF Gain set to its
best case condition, which is IF Gain = Low. b. Autocoupled sweep rates using Option FS1 or FS2 are ofte n too fast for excellent TOI performance. A sweep rate of 1.0 × RBW2 is often suitable for best TOI performance, because of how it affects the IF Prefilter settings Foot- note a links to the details.
both given in dBm units. In PXA, we no longer make that extrapolation in this Specifications Guide.
small as to be unmeasurable, and thus highly irrelevant, in many cases.
Full temperature Range (cont.) 3.5 to 8.4 GHz x +14 dBm 3.5 to 8.4 GHz x +13 dBm 8.3 to 13.6 GHz x
+14 dBm
13.5 to 17.1 GHz x
+13 dBm
13.5 to 17.1 GHz x
+10 dBm
17.0 to 26.5 GHzi x
+14 dBm
17.0 to 26.5 GHzi x
+10 dBm
a. See the IF Prefilter Bandwidth table in the Gain Compression specifications on page
48. When the tone separa-
c. TOI is verified with two tones, each at −16 dBm (10 MHz to 26.5 GHz) and −20 dBm (26.5 GHz to 50 GHz) at the
d. Traditionally, the distortion components from two tones, each at −30 dBm, were given as specifications. When
spectrum analyzers were not as good as they are now, these distortion products were easily measured. As spec-
trum analyzers improved, the measurement began to be made at higher levels and extrapolated to the indus-
try-standard
−30 dBm test level. This extrapolation was justified by excellent conformance with the third-order
model, wherein distortion in dBc was given by twice the difference between the test tone level and the intercept,
One reason we don’t extrapolate is that the model does not work as well as it had with higher levels of distortion
in older and less capable analyzers, so that the computation is misleading; distortions at low test levels will be
modestly higher than predicted from the formula. The second reason is that the distortion components are so
e. Intercept = TOI = third order intercept. The TOI is give n by the mixer tone level (in dBm) minus (distortion/2)
where distortion is the relative level of the distortion tones in dBc.
f. For Option EP0:
150 to 300 MHz +16 dBm
+19 dBm (typical)
300 to 600 MHz +17 dBm
+19 dBm (typical)
条件:Dynamic Range g. For mmW PXA with Option EP0: 34.4 to 50 GHz +10 dBm +13 dBm (typical)
For mmW PXA with Option MPB: 34.4 to 50 GHz +10 dBm +15 dBm (typical)
For mmW PXA without Option MPB: 34.4 to 50 GHz +9 dBm +15 dBm (typical) h. Band 0 is extendable (set “Extend Low Band” to On) to 3.7 GHz instead of 3.6 GHz in instruments with frequency option 508, 513 or 526. Subject to these conditions, statistical observations show that performance nominally
k. For mmW PXA with Option EP0:
l. For mmW PXA with Option MPB: 34.4 to 50 GHz +6 dBm
Nominal TOI vs. Input Frequency and Tone Separation [Plot] a a. This plot is not applicable to Option EP0.
fits within the same range within the
3.6 to 3.7 GHz frequencies as within the next lower specified frequency
range, but is not warranted. i. Intercept performance is nominally
3 dB better in this band in those analyzers which have either Option LNP or
Option MPB installed, or both, when these options are not in use.
j. For Option EP0:
For mmW PXA without Option MPB: 34.4 to 50 GHz
+5 dBm
条件:Phase Noise with Option EP1 Noise Sidebands
(Center Frequency =
1 GHza Best-case
条件:Internal Referencec) a. The nominal performance of the phase noise at center frequencies different than the one at which the specifica- tions apply (1 GHz) depends on the center frequency, band and the offset. For low offset frequencies, offsets well under 100 Hz, the phase noise increases by 20 × log[(f + 0.3225)/1.3225]. For mid-offset frequencies such
all increases are in units of decibels. b. Noise sidebands for lower offset frequencies, for ex ample, 10 kHz, apply with the phase noise optimization (PhNoise Opt) set to Best Close-in φ Noise. Noise sidebands for higher offset frequencies, for example, 1 MHz, as shown apply with the phase noise optimization set to Best Wide-offset φ Noise.
more information, see Phase Noise Effects, Ext Ref vs. Loop BW [Plot] on page 74.
d. Nominal phase noise was –75 dBc/Hz for instruments produced before approximately September 1, 2012.
as 50 kHz, phase noise trends as 20 × log[(f +
5.1225)/6.1225], and also varies chaotically an additional nomi-
nally ±2 dB versus the center frequency. For wide offset frequencies, offsets above about
500 kHz, phase noise
increases as 20 × log(N). N is the LO Multiple as shown on page
21; f is in GHz units in all these relationships
c. Specifications are given with the internal frequency reference. The phase noise at offsets below
100 Hz is
impacted or dominated by noise from the reference. Thus, performance with external references will not follow
the curves and specifications. When using an external reference with superior phase noise, we recommend set-
ting the external reference phase-locked-loop bandwidth to wide (60 Hz), to take advantage of that superior
performance. When using an external reference with inferior phase noise performance, we recommend setting
that bandwidth to narrow (15 Hz). In these relationships, inferior and superior phase noise are with respect to
–134 dBc/Hz at 30 Hz offset from a
10 MHz reference. Because most reference sources have phase noise
behavior that falls off at a rate of 30 dB/decade, this is usually equivalent to –120 dBc/Hz at 10 Hz offset. For
Offset Frequency
20 to 30°CF u l l r a n g e
10 Hz
−80 dBc/Hz (nominal)d
100 Hz −94 dBc/Hz −92 dBc/Hz
−100 dBc/Hz (typical)
1 kHz −121 dBc/Hz −118 dBc/Hz
−125 dBc/Hz (typical)
10 kHz −129 dBc/Hz −128 dBc/Hz
−132 dBc/Hz (typical)
30 kHz −130 dBc/Hz −129 dBc/Hz
−132 dBc/Hz (typical)
100 kHz −129 dBc/Hz −128 dBc/Hz
−131 dBc/Hz (typical)
1 MHze −145 dBc/Hz −144 dBc/Hz
−146 dBc/Hz (typical)
10 MHze −155 dBc/Hz −154 dBc/Hz
−158 dBc/Hz (typical)
条件:techniques of overdrive and noise subtraction can be used in measuring a DUT, of course.
Dynamic Range e. Analyzer-contributed phase noise at the low levels of this offset requires advanced verification techniques because broadband noise would otherwise cause excessive measurement error. Keysight uses a high level low phase noise CW test signal and sets the input attenuator so that the mixer level will be well above the normal
top-of-screen level (-10 dBm) but still well below the
1 dB compression level. This improves dynamic range
(carrier to broadband noise ratio) at the expense of amplitude uncertainty due to compression of the phase
noise sidebands of the analyzer. (If the mixer level were increased to the "1 dB Gain Compression Point," the
compression of a single sideband is specified to be
1 dB or lower. At lower levels, the compression falls off rap-
idly. The compression of phase noise sidebands is substantially less than the compression of a single-sideband
test signal, further reducing the uncertainty of this technique.) Keysight also measures the broadband noise of
the analyzer without the CW signal and subtracts its power from the measured phase noise power. The same
条件:Phase Noise with Option EP0 Noise Sidebandsa
(Center Frequency =
1 GHzb Best-case
条件:Narrow Ref Loop BW −88 dBc/Hz (nominal)
the PXA, AM sidebands are non-negligible contributors. These specifications apply to the sum of the AM and
PM sidebands. b. The nominal performance of the phase noise at center frequencies different than the one at which the specifica- tions apply (1 GHz) depends on the center frequency, band and the offset. For low offset frequencies, offsets well under 100 Hz, the phase noise increases by 20 × log[(f + 0.3225)/1.3225], where f is the larger of 0.5 and
Offset Frequency
20 to 30 °CF u l l r a n g e
10 Hz
Wide Ref Loop BW See note e
−95 dBc/Hz (typical)e
100 Hz −107 dBc/Hz −107 dBc/Hz
−112 dBc/Hz (typical)
1 kHz −125 dBc/Hz −124 dBc/Hz
−129 dBc/Hz (typical)
10 kHz −134 dBc/Hz −132 dBc/Hz
−136 dBc/Hz (typical)
100 kHz −139 dBc/Hz −138 dBc/Hz
−141 dBc/Hz (typical)
1 MHze −145 dBc/Hz −144 dBc/Hz
−146 dBc/Hz (typical)
10 MHz −155 dBc/Hz −154 dBc/Hz
−157 dBc/Hz (typical)
a. Noise sidebands around a signal are dominantly phase noise sidebands. With the extremely low phase noise of
the center frequency in GHz units. For mid-offset frequencies such as
50 kHz, phase noise trends as
20 × log[(f +
5.1225)/6.1225], where f is the larger of 1.0 and the carrier frequency in GHz units. For wide offset
frequencies, offsets above about 500 kHz, phase noise increases as 20 × log(N). N is the LO Multiple as shown
条件:offset frequencies, for example, 1 MHz, apply with the phase noise optimization set to Best Wide-Offset Noise.
more information, see Phase Noise Effects, Ext Ref vs. Loop BW [Plot] on page 74.
Dynamic Range c. Noise sidebands for lower offset frequencies, for exampl e, 10 kHz, apply with phase noise optimization (PNO) set to Balance Noise and Spurs. In some frequency settings of the analyzer, a spurious response
60 to 180 MHz offset from the carrier may be present unless the phase locked loop behavior is changed in a way that increases
the phase noise. This tradeoff is controlled such that the spurs are better than
–70 dBc, at the expense of up to
7 dB increase in phase noise within
±1 octave of 1 MHz offset for those settings where this spurious is likely to
be visible. To eliminate this phase noise degradation in exchange for the aforementioned spurs, Best Close-in
Noise should be used. When the setting is changed to Be st Spurs, the maximum spurious response is held to
–90 dBc, but the phase noise at all center frequencies is degraded by up to approximately
12 dB from the best
possible setting, mostly within
±1 octave of an offset of 400 kHz from the carrier. Noise sidebands for higher
d. Specifications are given with the internal frequency reference. The phase noise at offsets below
100 Hz is
impacted or dominated by noise from the reference. Thus, performance with external references will not follow
the curves and specifications. When using an external reference with superior phase noise, we recommend set-
ting the external reference phase-locked-loop bandwidth to wide (60 Hz), to take advantage of that superior
performance. When using an external reference with inferior phase noise performance, we recommend setting
that bandwidth to narrow (15 Hz). In these relationships, inferior and superior phase noise are with respect to
–134 dBc/Hz at 30 Hz offset from a
10 MHz reference. Because most reference sources have phase noise
behavior that falls off at a rate of 30 dB/decade, this is usually equivalent to –120 dBc/Hz at 10 Hz offset. For
e. Keysight measures 100% of the signal analyzers for phas e noise at 10 Hz offset from a
1 GHz carrier in the fac-
tory production process. This measurement requires a signal of exceptionally low phase noise that is character-
ized with specialized processes. It is impractical for field and customer use. Because field verification is
impractical, Keysight only gives a typical result. More than
80% of prototype instruments met this "typical"
specification; the factory test line limit is set commensurate with an on-going
80% yield to this typical. Like all
typical specifications, there is no guardbanding for measurement uncertainty. The factory test line limit is con-
sistent with a warranted specification of –90 dBc/Hz.
条件:Narrow selection is made, the internal noise effect is higher, but external reference noise above 20 Hz is rejected.
The noise curves were measured at 1 GHz center frequency with an excellent reference and excellent RF signal, and is thus
−93 dBc/Hz contribution. Add those together on a power scale as 10 x log10 (10(–97/10) + 10(–93/10)) = −91.5 dBc/Hz.
Phase Noise Effects, Ext Ref vs. Loop BW without Option EP0 [Plot]
The effect of the Ext Ref Loop BW control (Narrow and Wide) is shown in this graphic. When set to Wide, the noise from the
internal circuitry is reduced, but noise in the external reference is subject to being impressed on the LO through the transfer
function shown in the smooth curve labeled "Wide." For an excellent reference, this can give lower overall noise. When the
a conservative estimate of the residual noise of the PXA circuitry. At that center frequency, the transfer function curves
approach 40 dB gain to phase noise at low offset frequencies for a 10 MHz external reference. (This
40 dB is computed as
20 × log1010 ^(fC/fREF). The measured noise curves will scale with frequency the same way.)
Example: Consider an external reference at 10 MHz with phase noise of −135 dBc/Hz at 20 Hz offset. If the Narrow setting
is chosen, the analyzer noise density will be −86 dBc/Hz at 20 Hz offset, the gain to the reference will be
40 dB, giving
−95 dBc/Hz contribution. Add these together on a power scale as 10 x log10 (10(–86/10) + 10(–95/10)) =
−85.5 dBc/Hz. If
Wide is chosen, the analyzer noise density will be −97 dBc/Hz at 20 Hz offset, the gain to the reference will be
42 dB, giving
"Wide" will give a
6 dB superior result to the Narrow selection.
条件:performance is nominal only and not subject to any warranted specifications.
analyzers is very similar but not identical, you can estimate the nominal
performance of the measurements from the specification in this chapter.
The specifications for this section apply only to instruments with Frequency
Option 508
513, or 526. For instruments with higher frequency options, the
The measurement performance is only slightly different between instruments
with the higher frequency options. Because the hardware performance of the
条件:Absolute Power Accuracy (20 to 30°C, Attenuation = 10 dB) ±0.61 dB ±0.19 dB (95th percentile) a. See “Absolute Amplitude Accuracy” on page 40.
Case: Radio Std =
3GPP W-CDMA, or IS-95
b. See “Frequency and Time” on page
20.
条件:Minimum power at RF Input −36 dBm (nominal)
Case: Radio Std =
3GPP W-CDMA (ACPR; ACLR)f
ACPR Accuracyg RRC weighted
3.84 MHz noise bandwidth, method ≠
MS (UE) 5 MHz
±0.09 dB At ACPR range of −30 to −36 dBc with optimum mixer
MS (UE) 10 MHz
±0.09 dB At ACPR range of −40 to −46 dBc with optimum mixer
BTS 5 MHz
±0.25 dB At ACPR range of −42 to −48 dBc with optimum mixer
BTS 10 MHz
±0.18 dB At ACPR range of −47 to −53 dBc with optimum mixer
BTS 5 MHz
±0.10 dB At −48 dBc non-coherent ACPRk
Option EP0
MS (UE) 5 MHz
±0.09 dB At ACPR range of −30 to −36 dBc with optimum mixer
MS (UE) 10 MHz
±0.11 dB At ACPR range of −40 to −46 dBc with optimum mixer
BTS 5 MHz
±0.28 dB At ACPR range of −42 to −48 dBc with optimum mixer
BTS 10 MHz
±0.25 dB At ACPR range of −47 to −53 dBc with optimum mixer
BTS 5 MHz
±0.12 dB At −48 dBc non-coherent ACPRk
Dynamic Range RRC weighted
3.84 MHz noise
Freq Method ACLR (typical)m
ACLR (EP0)
Off 5 MHz Filtered IBW −81.5 dB −80 dB
−8 dBm
Off 5 MHz Fast −81 dB −80 dB
−8 dBm
Off 10 MHz Filtered IBW −87 dB −86 dB
−4 dBm
On 5 MHz Filtered IBW −82.5 dB −81.5 dB
−8 dBm
On 10 MHz Filtered IBW −88.0 dB −87 dB
−4 dBm
条件:TOI-induced spectrum rms CW error 0.00 dB nominal 0.001 dB nominal
relative scale fidelity is nominally only 0.01 dB larger than the absolute scale fidelity.
their −3 dB widths. To achieve a passband whose −6 dB width is x, set the Ref BW to be x − 0.572 × RBW.
mined from the ACPR reported by merely reversing the sign. g. The accuracy of the Adjacent Channel Power Ratio will depend on the mixer drive level and whether the distor- tion products from the analyzer are coherent with those in the UUT. These specifications apply even in the worst case condition of coherent analyzer and UUT distortion products. For ACPR levels other than those in this speci-
0.012 dB nominal
a. The effect of scale fidelity on the rati o of two powers is called the relative scale fidelity. The scale fidelity specified
in the Amplitude section is an absolute scale fidelity with –35 dBm at the input mixer as the reference point. The
b. See Amplitude Accuracy and Range section. c. See Frequency and Time section. d. Expressed in decibels. e. An ACP measurement measures the power in adjacent ch annels. The shape of the response versus frequency of
those adjacent channels is occasionally critical. One parameter of the shape is its
3 dB bandwidth. When the
bandwidth (called the Ref BW) of the adjacent channel is set, it is the
3 dB bandwidth that is set. The passband
response is given by the convolution of two functions: a rectangle of width equal to Ref BW and the power
response versus frequency of the RBW filter used. Measurements and specifications of analog radio ACPs are
often based on defined bandwidths of measuring receivers, and these are defined by their
−6 dB widths, not
f. Most versions of adjacent channel power measurements use negative numbers, in units of dBc, to refer to the
power in an adjacent channel relative to the power in a main channel, in accordance with ITU standards. The
standards for W-CDMA analysis include ACLR, a positive number represented in dB units. In order to be consis-
tent with other kinds of ACP measurements, this measurement and its specifications will use negative dBc
results, and refer to them as ACPR, instead of positive dB results referred to as ACLR. The ACLR can be deter-
fications table, the optimum mixer drive level for accuracy is approximately
−37 dBm − (ACPR/3), where the
条件:optimize dynamic range instead of accuracy, accuracy errors are nominally doubled.
analyzer noise and distortion to accuracy, though the higher mixer level increases the display scale fidelity errors.
specification; the factory test line limit is set commensurate with an on-going 80% yield to this typical.
ferent conditions. The test signal is a 1 DPCH signal.
The ACPR dynamic range is the observed range. This typical specification includes no measurement uncertainty.
n. ML is Mixer Level, which is defined to be the input signal level minus attenuation.
RBW filter. The effectiveness of this compensation is summarized in three ways:
Power Suite Measurements h. To meet this specified accuracy when measuring mobile station (MS) or user equipment (UE) within 3 dB of the required
−33 dBc ACPR, the mixer level (ML) must be optimized for accuracy. This optimum mixer level is
−22 dBm, so the input attenuation must be set as close as possible to the average input power − (−22 dBm). For
example, if the average input power is
−6 dBm, set the attenuation to 16 dB. This specification applies for the
normal
3.5 dB peak-to-average ratio of a single code. Note that, if the mixer level is set to optimize dynamic
range instead of accuracy, accuracy errors are nominally doubled.
i. ACPR accuracy at 10 MHz offset is warranted when the in put attenuator is set to give an average mixer level of
−14 dBm.
j. In order to meet this specified accuracy, the mixer leve l must be optimized for accuracy when measuring node B
Base Transmission Station (BTS) within 3 dB of the required −45 dBc ACPR. This optimum mixer level is
−18
dBm, so the input attenuation must be set as close as possible to the average input power − (−18 dBm). For
example, if the average input power is
−6 dBm, set the attenuation to 12 dB. This specification applies for the
normal 10 dB peak-to-average ratio (at 0.01% probability) for Test Model 1. Note that, if the mixer level is set to
k. Accuracy can be excellent even at low ACPR levels assu ming that the user sets the mixer level to optimize the
dynamic range, and assuming that the analyzer and UUT distortions are incoherent. When the errors from the
UUT and the analyzer are incoherent, optimizing dynamic range is equivalent to minimizing the contribution of
This incoherent addition case is commonly used in the industry and can be useful for comparison of analysis
equipment, but this incoherent addition model is rarely justified. This derived accuracy specification is based on a
mixer level of −14 dBm.
l. The dynamic range shown with Noise Correction = Off appl ies with Noise Floor Extension On. (Noise Correction is
the process within the measurement of making a calibration of the noise floor at the exact analyzer settings used
for the measurement. Noise Floor Extension is the factory calibration of the noise floor.)
m. Keysight measures 100% of the signal analyzers for dynamic range in the factory production process. This mea-
surement requires a near-ideal signal, which is impractical for field and customer use. Because field verification
is impractical, Keysight only gives a typical result. More than
80% of prototype instruments met this “typical”
The ACPR dynamic range is verified only at 2 GHz, where Keysight has the near-perfect signal available. The
dynamic range is specified for the optimum mixer drive level, which is different in different instruments and dif-
o.
3GPP requires the use of a root-raised- cosine filter in evaluating the ACLR of a device. The accuracy of the pass-
band shape of the filter is not specified in standards, nor is any method of evaluating that accuracy. This footnote
discusses the performance of the filter in this instrument. The effect of the RRC filter and the effect of the RBW
used in the measurement interact. The analyzer compensates the shape of the RRC filter to accommodate the
− White noise in Adj Ch: The compensated RRC filter nominally has no errors if the adjacent channel has a spec-
trum that is flat across its width
条件:error for RBWs between 27 and 390 kHz is 0.05 dB for a 330 kHz RBW filter.
− TOI−induced spectrum: If the spectrum is due to third−order intermodulation, it has a distinctive shape. The
computed errors of the compensated filter are −0.001 dB for the
100 kHz RBW used for UE testing with the IBW
method. It is 0.000 dB for the
27 kHz RBW filter used for BTS testing with the Filtered IBW method. The worst
− rms CW error: This error is a measure of the error in measuring a CW−like spurious component. It is evaluated
by computing the root of the mean of the square of the power error across all frequencies within the adjacent
channel. The computed rms error of the compensated filter is 0.012 dB for the
100 kHz RBW used for UE testing
with the IBW method. It is 0.000 dB for the
27 kHz RBW filter used for BTS testing. The worst error for RBWs
between 27 kHz and 470 kHz is 0.057 dB for a
430 kHz RBW filter.
Case: Radio Std = 3GPP W-CDMA RRC weighted
3.84 MHz noise bandwidth, Noise
ACPR Accuracy (4 carriers)
Radio Offset Cohera UUT ACPR Range MLOptb
条件:effects in the amplifier. b. Optimum mixer level (MLOpt). The mixer level is given by the average power of the sum of the four carriers minus the input attenuation.
BTS 5 MHz no ±0.09 dB −42 to −48 dB
−15 dBm
BTS 5 MHz no (Option EPO) ±0.10 dB −42 to −48 dB
−15 dBm
a. Coher = no means that the specified accuracy only applies when the distortions of the device under test are not
coherent with the third-order distortions of the analyzer. Incoherence is often the case with advanced
multi-carrier amplifiers built with compensations and predistortions that mostly eliminate coherent third-order
Histogram Resolutiona
0.01 dB
a. The Complementary Cumulative Distribution Function ( CCDF) is a reformatting of a histogram of the power
envelope. The width of the amplitude bins used by the histogram is the histogram resolution. The resolution of
Maximum harmonic number
10th
Spurious Emissions Table-driven spurious signals; search across regions
Case: Radio Std =
3GPP W-CDMA
Dynamic Rangea, relative (RBW=1 MHz)
(1 to 3.6 GHz)
Dynamic Rangea, relative (RBW=1 MHz)
(1 to 3.6 GHz) (Option EP0)
Sensitivityb, absolute (RBW=1 MHz)
(1 to 3.6 GHz)
−88.5 dBm
−91.5 dBm (typical)
Sensitivityb, absolute (RBW=1 MHz)
(1 to 3.6 GHz) (Option EP0)
−86.5 dBm
−89.5 dBm (typical)
Accuracy Attenuation =
10 dB
20 Hz to 3.6 GHz
±0.19 dB (95th percentile)
3.5 to 8.4 GHz
±1.09 dB (95th percentile)
3.5 to 8.4 GHz (Option EP0)
±1.15 dB (95th percentile)
8.3 to 13.6 GHz
±1.48 dB (95th percentile)
8.3 to 13.6 GHz (Option EP0)
±1.52 dB (95th percentile)
a. The dynamic range is specified at 12.5 MHz offset from center frequency with mixer level of 1 dB compression
point, which will degrade accuracy
1 dB.
Spectrum Emission Mask Table-driven spurious signals; measurement near carriers
Case: Radio Std = cdma2000
Dynamic Range, relative (750 kHz offsetab) 85.0 dB
89.3 dB (typical)
Dynamic Range, relative (750 kHz offsetab) (Option EP0) 83.3 dB
87.3 dB (typical)
Sensitivity, absolute (750 kHz offsetc)
−103.7 dBm
−106.7 dBm (typical)
Sensitivity, absolute (750 kHz offsetc) (Option EP0)
−101.7 dBm
−104.7 dBm (typical)
Accuracy (750 kHz offset)
Absolutee (20 to 30°C) ±0.62 dB ±0.21 dB (95th percentile ≈
2σ)
Case: Radio Std =
3GPP W−CDMA
Dynamic Range, relative (2.515 MHz offsetad) 86.9 dB
91.8 dB (typical)
Dynamic Range, relative (2.515 MHz offsetad) (Option EP0) 85.0 dB
89.6 dB (typical)
Sensitivity, absolute (2.515 MHz offsetc)
−103.7 dBm
−106.7 dBm (typical)
Sensitivity, absolute (2.515 MHz offsetc) (Option EP0)
−101.7 dBm
−104.7 dBm (typical)
Accuracy (2.515 MHz offset)
Absolutee (20 to 30°C) ±0.62 dB
±0.21 dB (95th percentile)
条件:spectrum emission levels in the offsets that are well above the dynamic range limitation.
Power Suite Measurements a. The dynamic range specification is the ratio of the ch annel power to the power in the offset specified. The dynamic range depends on the measurement settings, such as peak power or integrated power. Dynamic range specifications are based on default measurement settings, with detector set to average, and depend on the
mixer level. Default measurement settings include
30 kHz RBW.
b. This dynamic range specification applies for the optimum mixer level, which is about
−18 dBm. Mixer level is
defined to be the average input power minus the input attenuation.
c. The sensitivity is specified with 0 dB input attenuation. It represents the noise limitations of the analyzer. It is
tested without an input signal. The sensitivity at this offset is specified in the default
30 kHz RBW, at a center
frequency of 2 GHz.
d. The relative accuracy is a measure of the ratio of the power at the offset to the main channel power. It applies for
e. The absolute accuracy of SEM measurement is the same as the absolute accuracy of the spectrum analyzer. See
“Absolute Amplitude Accuracy” on page
40 for more information. The numbers shown are for 0 to 3.6
GHz, with attenuation set to 10 dB.
条件:The following options and applications affect instrument specifications.
Option 503: Frequency range
2 Hz to 3.6 GHz
Option 508: Frequency range
2 Hz to 8.4 GHz
Option 513: Frequency range
2 Hz to 13.6 GHz
Option 526: Frequency range
2 Hz to 26.5 GHz
Option 544: Frequency range
2 Hz to 44 GHz
Option 550: Frequency range
2 Hz to 50 GHz
Option ALV: Auxiliary Log Video output
Option B1X: Analysis bandwidth
160
Standard B25: Analysis bandwidth
25 MHz
Option B40: Analysis bandwidth
40 MHz
Option B85: Analysis bandwidth
85 MHz
Option B2X Analysis bandwidth
255 MHz
Option B5X: Analysis bandwidth
510 MHz
Option C35: APC 3.5 mm connector (for Freq Option
526 only)
Option CR3: Connector Rear, second IF Out
选件 CRP: 连接器后面板, arbitrary IF Out
Option EA3: Electronic attenuator
3.6 GHz
Option EMC: Precompliance EMC Features
Option EP0: Enhanced Phase noise, DDS LO
Standard NFE: Noise floor extension, instrument alignment
Option P03: Preamplifier
3.6 GHz
Option P08: Preamplifier
8.4 GHz
Option P13: Preamplifier
13.6 GHz
Option P26: Preamplifier
26.5 GHz
Option P44: Preamplifier
44 GHz
Option P50: Preamplifier
50 GHz
Option RT1: Real-Time analysis up to 160 MHz, basic detection
Option RT2: Real-Time analysis up to 160 MHz, optimum detection
N9054EM0E: Flexible Digital Demodulation measurement application
N9054EM1E: Custom OFDM measurement application
N9063EM0E: Analog Demodulation measurement application
N9067EM0E: Pulse measurement application
N9068EM0E: Phase Noise measurement application
N9069EM0E: Noise Figure measurement application
N9071EM0E: GSM/EDGE/EDGE Evolution measurement application
N9073EM0E: W-CDMA/HSPA/HSPA+ measurement application
N9077EM0E: WLAN measurement application
N9080EM0E: LTE-Advanced FDD measurement application
N9081EM0E: Bluetooth Measurement application
N9082EM0E: LTE-Advanced TDD measurement application
N9083EM0E: MSR measurement application
N9084EM0E: Short Range Communications measurement application
N9085EM0E
5G NR measurement application
N9092EM0E: Avionics measurement application
条件:Deratinga a. The maximum operating temperature derates linearly from altitude of 4,600 m to 2,300 m.
Altitude ≤ 2,300 m0 t o
5 °C
Altitude = 4,600 m
0 to 47 °C
Altitude 4,600 m (approx
15,000 feet)
Relative humidity
95% relative humidity, non-condensing at
40°C, decreasing linearly to 50% relative
humidity at 55°C.
条件:altitude and power line conditions. Test Methods are aligned with IEC 60068-2 and levels are similar to
Samples of this product have been type tested in accordance with the Keysight Environmental Test
Manual and verified to be robust against the environmental stresses of Storage, Transportation and End-use; those stresses include but are not limited to temperature, humidity, shock, vibration,
Acoustic Noise Values given are per ISO
7779 standard in the "Operator Sitting"
< 40°C Nominally under 55 dBA Sound Pressure.
55 dBA is generally
considered suitable for use in quiet office environments
≥ 40°C Nominally under 65 dBA Sound Pressure.
65 dBA is generally
considered suitable for use in noisy office environments. (The fan
speed, and thus the noise level, increases with increasing ambient
Voltage 100 /120 V
±10% operating range
Voltage 220 /240 V
±10% operating range
Power Consumption, On
630 W Maximum
Power Consumption, Standby
45 W Standby power is not supplied to the
频率参考 oscillator but 至 CPU
条件:Typical instrument configuration Power (nominal)
Base PXA instrument B85/B1X/B2X/B5X
330 W
Adding Option B85/B1X to base instrument
+45 W
Adding Option BBA to base instrument
+46 W
条件:Libraries Suite Version 14.1, one meter GPIB cable, National Instruments PCI-GPIB Card and NI-488.2 DLL.
Local measurement and display update ratebc
10 ms (100/s)
Remote measurement and LAN transfer ratebc
10 ms (100/s)
Center Frequency Tune and Transfer (Band 0)
43 ms
Center Frequency Tune and Transfer (Bands 1-4)
69 ms
Measurement/Mode Switching
40 ms
W-CDMA ACLR measurement time See page
76
b. Factory preset, fixed center frequency, RBW = 1 MHz, 10 MHz < span ≤ 600 MHz, stop frequency ≤
3.6 GHz
Auto Align Off. c. Phase Noise Optimization set to Fast Tuning, Display Of f, 32 bit integer format, markers Off, single sweep, mea- sured with IBM compatible PC with 2.99 GHz Pentium® 4 with 2 GB RAM running Windows® XP , Keysight I/O
条件:Size 269 mm (10.6 in) diagonal (nominal)
onds. This is normal and does not affect the measurement integrity of the product in any way.
Resolution 1280 ×
800 Capacitive multi-touch screen
a. The LCD display is manufactured using high precision tec hnology. However, if a static image is displayed for a
lengthy period of time (~2 hours) you might encounter "image sticking" that may last for approximately
2 sec-
Internal Total Removable solid state drive ( ≥
160 GB)
Internal User ≥
9 GB available on separate partition for user
条件:Shipping 34 kg (75 lbs) (nominal)
Cabinet Dimensions Cabinet dimensions exclude front and rear protrusions.
Net
22 kg (48 lbs) (nominal)
Standard Type-N female Frequency Option 503, 508
513, and 526
2.4 mm male Frequency Option
544, and 550
Option C35 3.5 mm male Frequency Option
526 only
Host (3 ports) Compliant with USB
2.0
条件:Port marked with Lightning Bolt 1.2 A (nominal)
Port not marked with Lightning Bolt
0.5 A
条件:Output Power 90 mW per channel into 16 Ω (nominal)
Connector miniature stereo audio jack
3.5 mm (also known as "1/8 inch")
Description Specifications Supplemental Information
10 MHz Out
条件:Output Amplitude ≥0 dBm (nominal)
Output Configuration AC coupled, sinusoidal
(1 + frequency reference accuracy)
条件:response performance may be affected by the quality of the external reference used. See footnote in the Phase Noise specifications within the Dynamic Range section on page 67.
Connector BNC female Note: Analyzer noise sidebands and spurious
输入幅度量程 sine wave square wave
条件:0.2 to 1.5 V peak-to-peak (nominal)
Input Frequency 1 to 50 MHz (nominal)
−5 to +10 dBm (nominal)
(selectable to 1 Hz resolution)
Lock range ±2 ×
10−6 of ideal external
Trigger Inputs (Trigger 1 In, Trigger
2 In)
Impedance
10 k Ω (nominal)
Trigger Level Range −5 to +5 V
1.5 V (TTL) factory preset
Trigger Outputs (Trigger 1 Out, Trigger
2 Out)
Monitor Output
1 (Option PC6
PC6S, PC8 CPUs)
Connector
15-pin mini D-SUB
Format XGA (60 Hz vertical sy nc rates, non-interlaced)
Monitor Output
2 (Option PC6
PC6S, PC8 CPUs)
Connector Mini DisplayPort
Noise Source Drive
+28 V (Pulsed)
Output voltage on 28.0 ± 0.1 V
60 mA maximum current
Output voltage off
<1.0 V
SNS Series Noise Source For use with Keysight/Agilent Technologies SNS Series noise sources
Digital Bus This port is intended for use with the Agilent/Keysight N5105 and N5106
products only. It is not available for general purpose use
Connector MDR-80
USB Ports (Option PC6, PC6S,
PC8 CPUs)
Host, stacked with LAN
1 port
Thunderbolt (Option PCA CPU)
Connector USB Type-C (female)
2 ports
Connector IEEE-488 bus connector
GPIB Codes SH1, AH1, T6, SR1, RL
1, PP0, DC1, C1, C2, C3 and
C28, DT1, L4, C0
LAN TCP/IP Interface (Option PC6,
PC6S, PC8 CPUs)
Connector RJ45 Ethertwist
LAN TCP/IP 接口 (选件 PCA CPU)
Connector RJ45 Ethertwist
Connector RJ45 Ethertwist
条件:industry standards, and has been supplied in a safe condition. The instruction
This product is designed for use in Installation Category II and Pollution Degree
2 per IEC 61010
3rd ed, and 664 respectively.
This product has been designed and tested in accordance with accepted
documentation contains information and warnings which must be followed by
the user to ensure safe operation and to maintain the product in a safe
This product is intended for indoor use
The CE mark is a registered trademark of the European Community (if accompanied
by a year, it is the year when the design was proven). This product complies with all
The UK conformity mark is a UK government owned mark. Products showing this
mark comply with all applicable UK regulations
The RCM mark is a registered trademark of the Australian Communications and
条件:South Korean Certification (KC) mark. It includes the marking’s identifier code.
ISM 1-A This is a symbol of an Industrial Scientific and Medical Group 1 Class A product.
CAN ICES/NMB-001(A) Canada EMC label.
Interference-Causing Equipment Standard for industrial, scientific and medical (ISM)
equipment. Matériel industriel, scientifique et médical (ISM)
This is a space saver label that combines two markings – CAN ICES and ISM
条件:This is a space saver label that combines three markings – CE, CAN ICES, and ISM.
The CSA mark is a registered trademark of the CSA International.
The crossed-out wheeled bin symbol indicates that separate collection for waste
electric and electronic equipment (WEEE) is required, as obligated by the EU
EMC: Complies with the essential requirements of the European EMC Directive
and the UK Electromagnetic Compatibility Regulations
2016 as well as current
editions of the following standards (dates and editions are cited in the
Declaration of Conformity)
— CISPR 11, Group
1, Class A
— ICES/NMB-001
This ISM device complies with Canadian ICES-001.
Cet appareil ISM est conforme a la norme NMB-001 du Canada.
South Korean Class A EMC declaration
This equipment has been conformity assessed for use in business
environments. In a residential environment this equipment may cause radio
SAFETY: Complies with the essential requirements of the European Low
Voltage Directive as well as current editions of the following standards (dates
and editions are cited in the Declaration of Conformity)
— Canada: CSA C22.2 No.
61010-1
China Restricted Substance Product Label. The EPUP (environmental protection use
period) number in the center indicates the time period during which no hazardous or
toxic substances or elements are expected to leak or deteriorate during normal use
and generally reflects the expected useful life of the product.
Universal recycling symbol. This symbol indicates compliance with the China
standard GB
18455-2001 as required by the China RoHS regulations for
paper/fiberboard packaging
This is a sensitive measurement apparatus by design and may have some performance
loss (up to 25 dBm above the Spurious Responses, Residual specification of -100 dBm)
when exposed to ambient continuous electromagnetic phenomenon in the range of
80 MHz -2.7 GHz when tested per IEC
61000-4-3.
Normal operation mode per ISO
7779
To find a current Declaration of Conformity for a specific Keysight product, go
Specification Guide
2 I/Q Analyzer
This chapter contains specifications for the I/Q Analyzer measurement
Resolution Bandwidth See “Frequency” on page
99 in this chapter.
Clipping-to-Noise Dynamic Range See “Clipping-to-Noise Dynamic Range” on page
100 in this
Available Detectors Does not apply
Spurious Responses The “Spurious Responses” on page
59 of core specifications still
apply. Additional bandwidth-option-dependent spurious responses are
given in the Analysis Bandwidth chapter for any optional bandwidths in
IF Amplitude Flatness See “IF Frequency Response” on page
38 of the core
specifications for the
10 MHz bandwidth. Specifications for wider
bandwidths are given in the Analysis Bandwidth chapter for any
optional bandwidths in use
IF Phase Linearity See “IF Phase Linearity” on page
39 of the core specifications for
the
10 MHz bandwidth. Specifications for wider bandwidths are given
in the Analysis Bandwidth chapter for any optional bandwidths in use.
Data Acquisition See “Data Acquisition” on page
101 in this chapter for the
10 MHz bandwidth. Specifications for wider bandwidths are given in
the Analysis Bandwidth chapter for any optional bandwidths in use.
Standard instrument
10 Hz to10 MHz
Standard B25
10 Hz to 25 MHz
Option B40
10 Hz to 40 MHz
Option B85
10 Hz to 85 MHz
Option B1X
10 Hz to 160 MHz
Option B2X
10 Hz to 255 MHz
Option B5X
10 Hz to 510 MHz
100 MHz to 3 MHz
50 Hz to 1 MHz
1 Hz to 10 kHz
100 MHz to 100 Hz
Gaussian, Blackman, Blackman-Harris, Kaiser
Bessel (K-B 70 dB, K-B 90 dB & K-B
110 dB)
Standard B25
10 Hz to 25 MHz
Option B40
10 Hz to 40 MHz
Option B85
10 Hz to 85 MHz
Option B1X
10 Hz to 160 MHz
Option B2X
10 Hz to 255 MHz
Option B5X
10 Hz to 510 MHz
Excluding residuals and spurious responses
条件:IF Gain = Low −10 dBm −8 dBm (nominal)
IF Gain = High −20 dBm −17.5 dBm (nominal)
Noise Density at Mixer at center frequencyb b. The noise density depends on the input frequency. It is lowest for a broad range of input frequencies near the center frequency, and these specifications apply there. The noise density can increase toward the edges of the
ing how to combine the IF Gain noise with the DANL. e. DANL is specified for log averaging, not power averaging, and thus is 2.51 dB lower than the true noise density.
Examplef f. As an example computation, consid er this: For the case where DANL = −151 dBm in 1 Hz, IF Gain is set to low, and the “Additional DANL” is −160 dBm, the total noise density computes to −148.2 dBm/Hz and the Clip- ping-to-noise ratio for a −10 dBm clipping level is −138.2 dBFS/Hz.
Clipping Level at Mixer Center frequency ≥
20 MHz
span. The effect is nominally well under
1 dB.
(DANLc + IFGainEffectd) +
2.25
dBe c. The primary determining element in the noise density is the “DANL without Noise Floor Extension and without Option EP0” on page 50. d. DANL is specified with the IF Gain set to High, which is the best case for DANL but not for Clipping-to-noise
dynamic range. The core specifications “DANL without Noise Floor Extension and without Option
EP0” on page
50, gives a line entry on the excess noise added by using IF Gain = Low, and a footnote explain-
It is also specified in the narrowest RBW, 1 Hz, which has a noise bandwidth slightly wider than
1 Hz. These two
effects together add up to 2.25 B.
条件:a. Requires instrument software version >=A.31.00. Ot herwise, IQ Sample Pairs is limited to 8,000,001.
Waveform measurementb b. This can also be accessed with the remo te programming command of "read:wav0?".
IQ Analyzer
32,000,001 IQ sample pairs a
Advanced Tools Data Packing
89600 VSA software or Fast
Capturec c. This can only be accessed with the remote programming command of "init:fcap" in the IQ Analyzer (Basic) wave- form measurement. 32-bit
64-bit
Length (IQ sample pairs) 536 MSa (2 29 Sa) 268 MSa (2 28 Sa)
2 GB total memory
Maximum IQ Capture Time Data Packing (89600 VSA and Fast Capture) 32-bit
64-bit Calculated by: Length of IQ sample pairs/Sample Rate (IQ
Pairs)d d. For example, using 32-bit data packing at 10 MHz IF ba ndwidth (IFBW) the Maximum Capture Time is calculated using the formula: "Max Capture Time = (229)/(10 MHz × 1.25)". 10 MHz IFBW 42.94 s
21.47 s
Sample Rate (IQ Pairs)
1.25 × IFBW
Specification Guide
3 Option B25 - 25 MHz Analysis Bandwidth
This chapter contains specifications for the standard Option B25
25 MHz
Analysis 带宽, 和 unique 至 this IF 通路
Option B25 - 25 MHz Analysis Bandwidth
Specifications Affected by Analysis Bandwidth
The specifications in this chapter apply when the
25 MHz path is in use. In IQ
Analyzer, this will occur when the IF Path is set to 25 MHz, whether by Auto
IF 相位线性度见规格 · this chapter
Spurious and Residual Responses The “Spurious Responses” on page
59 still apply. Further
bandwidth-option-dependent spurious responses are contained within
The performance of the analyzer will degrade by an unspecified extent
when using this bandwidth option. This extent is not substantial enough
to justify statistical process control
Option B25 - 25 MHz Analysis Bandwidth
条件:IF Spurious Responsea a. The level of these spurs is not warranted. The relationsh ip between the spurious response and its excitation is described in order to make it easier for the user to distinguish whether a questionable response is due to these mechanisms. f is the apparent frequency of the spurious signal, fc is the measurement center frequency.
Preamp Offb b. The spurious response specifications only apply with the preamp turned off. When the preamp is turned on, per- formance is nominally the same as long as the mixer level is interpreted to be Mixer Level = Input Level − Input
条件:Any on-screen f (f + fc + 22.5 MHz)/2 −15 dBm Low −54 dBc (nominal)
−25 dBm High
−54 dBc (nominal)
Apparent Freq Excitation Freq Mixer Levelc IF Gain
条件:Any on-screen f 2 × fc − f + 45 MHz −10 dBm Low −70 dBc (nominal)
−20 dBm High
−70 dBc (nominal)
Option B25 - 25 MHz Analysis Bandwidth
IF Frequency Responsea Freq Option 526 only Modes above
18 GHzb
(Demodulation and FFT response relative to the center frequency)
Preselector Max Errord Midwidth
Error (95th
Slope (dB/MHz) (95th
条件:c. This column applies to the instantaneous analysis bandwid th in use. In the Spectrum analyzer Mode, this would
be the FFT width. For Span <10 MHz. see “IF Frequency Response” on page 38.
times better at most center frequencies. e. The “RMS” nominal performance is the standard deviation of the response relative to the center frequency, inte- grated across the span. This performance measure was observed at a center frequency in each harmonic mixing band, which is representative of all center frequencies; it is not the worst case frequency.
≥ 0.02, ≤ 3.6 10 to ≤ 25 n/a ±0.30 dB ±0.12 dB ±0.10
0.05 dB
3.6 to 26.5 10 to ≤ 25f On
0.50 dB
3.6 to 26.5 10 to ≤ 25 Offg ±0.40 dB ±0.12 dB ±0.10
0.04 dB
26.5 to 50 10 to ≤ 25f On
0.31 dB
26.5 to 50 10 to ≤ 25 Offg ±0.40 dB
0.02 dB
a. The IF frequency response includes effects due to RF circui ts such as input filters, that are a function of RF fre-
quency, in addition to the IF passband effects. b. Signal frequencies above 18 GHz are prone to additional response errors due to modes in the Type-N connector used. Only analyzers with frequency Option 526 that do not also have input connector Option C35 will have these modes.With the use of Type-N to APC 3.5 mm adapter part number
1250-1744, there are nominally six
such modes. These modes cause nominally up to −0.35 dB amplitude change, with phase errors of nominally up
to ±1.2°.
d. The maximum error at an offset (f) from the center of the FFT width is given by the expression ± [Midwidth Error +
(f × Slope)], but never exceeds ±Max Error. Here the Midwidth Error is the error at the center frequency for the
given FFT span. Usually, the span is no larger than the FFT width in which case the center of the FFT width is the
center frequency of the analyzer. In the Spectrum Analyzer mode, when the analyzer span is wider than the FFT
width, the span is made up of multiple concatenated FFT results, and thus has multiple centers of FFT widths so
the f in the equation is the offset from the nearest center. These specifications include the effect of RF frequency
response as well as IF frequency response at the worst case center frequency. Performance is nominally three
f. For information on the preselector which affect s the passband for frequencies above
3.6 GHz when Option MPB
is not in use, see “Preselector Bandwidth” on page
32.
g. Option MPB is installed and enabled
Option B25 - 25 MHz Analysis Bandwidth
IF 相位线性度 Deviation 从 mean 相位线性度
For Freq Option 526 only: Modes above
18 GHz
条件:Without Option EP0 With Option EP0
from a linear phase condition, where the RMS is computed across the span shown.
≥ 0.02, ≤ 3.6 25 n/a 0.48° 0.12° 0.47°
0.12°
> 3.6 25 Offb 0.85° 0.20° 1.1°
0.28°
a. The listed performance is the standard deviation of th e phase deviation relative to the mean phase deviation
b. Option MPB is installed and enabled
条件:Nominal Phase Linearity [Plot]a
the analyzer does not depend on the frequency option. a. This graph is not applicable to Option EP0.
The phase characteristics of analysis frequencies below 3.6 GHz are similar to the
1.8 GHz graph shown. For analysis
above 3.6 GHz, the curves shown are representative. They were measured between
5 and 25 GHz. The phase linearity of
Option B25 - 25 MHz Analysis Bandwidth
subject to gain limitationsc
条件:a. This table is meant to help predict the full-scale level, defined as the signal level for which ADC overload (clip-
ping) occurs. The prediction is imperfect, but can serve as a starting point for finding that level experimentally.
A SCPI command is also available for that purpose. b. Mixer level is signal level minus input attenuation. c. The available gain to reach the predicted mixer level will vary with center frequency. Combinations of high gains and high frequencies will not achieve the gain required, increasing the full scale level.
Effect of signal frequency ≠ CF up to ±3d B ( n o m i n a l )
Option B25 - 25 MHz Analysis Bandwidth
条件:a. Requires instrument software version >=A.31.00. Ot herwise, IQ Sample Pairs is limited to 8,000,001.
Waveform measurementb b. This can also be accessed with the remo te programming command of "read:wav0?".
IQ Analyzer
32,000,001 IQ sample pairsa
Advanced Tools Data Packing
89600 VSA software or Fast
Capturec c. This can only be accessed with the remote programming command of "init:fcap" in the IQ Analyzer (Basic) wave- form measurement. 32-bit
64-bit
Length (IQ sample pairs) 536 MSa (2 29 Sa) 268 MSa (2 28 Sa)
2 GB total memory
Maximum IQ Capture Time Data Packing (89600 VSA and Fast Capturec) 32-bit
64-bit Calculated by: Length of IQ sample pairs/Sample Rate (IQ
Pairs)d d. For example, using 32-bit data packing at 10 MHz IF ba ndwidth (IFBW) the Maximum Capture Time is calculated using the formula: "Max Capture Time = (229)/(10 MHz × 1.25)". 10 MHz IFBW 42.94 s
21.47 s
25 MHz IFBW 17.17 s
8.58 s
Sample Rate (IQ Pairs)
1.25 × IFBW
Option B25 - 25 MHz Analysis Bandwidth
Specification Guide
4 Option B40 - 40 MHz Analysis Bandwidth
This chapter contains specifications for the Option B40
40 MHz Analysis
带宽, 和 unique 至 this IF 通路
Option B40 - 40 MHz Analysis Bandwidth
Specifications Affected by Analysis Bandwidth
The specifications in this chapter apply when the
40 MHz path is in use. In IQ
Analyzer, this will occur when the IF Path is set to 40 MHz, whether by Auto
IF 相位线性度见规格 · this chapter
条件:Spurious Responses There are three effects of the use of Option B40 on spurious responses.
Most of the warranted elements of the “Spurious Responses” on
page 59 still apply without changes, but the revised-version of the table
on page 59, modified to reflect the effect of Option B40, is shown in its
place in this chapter. The image responses part of that table have the
same warranted limits, but apply at different frequencies as shown in the
table. The "higher order RF spurs" line is slightly degraded. Also,
spurious-free dynamic range specifications are given in this chapter, as
条件:the same manner. Nominal performance statements are given in this
Displayed Average Noise Level See specifications in this chapter.
Third-Order Intermodulation This bandwidth option can create additional TOI products to those that
are created by other instrument circuitry. These products do not behave
with typical analog third-order behavior, and thus cannot be specified in
chapter, but they cannot be expected to decrease as the cube of the
Phase Noise The performance of the analyzer will degrade by an unspecified extent
when using wideband analysis. This extent is not substantial enough to
justify statistical process control
Absolute Amplitude Accuracy Nominally
0.5 dB degrad ation from base instrument absolute amplitude
accuracy. (Refer to Absolute Amplitude Accuracy on page
40.)
Specifications on this bandwidth only apply with center frequencies of
30 MHz and higher.
Option B40 - 40 MHz Analysis Bandwidth
以上指标摘自厂家官方数据手册,完整定义、测试条件与保证值口径以手册为准。完整指标、测试条件与定义口径请见产品页「软件和手册 | 白皮书」栏目中的官方数据手册。
是德科技 | KEYSIGHT · onetest 仪器资源库


 客服







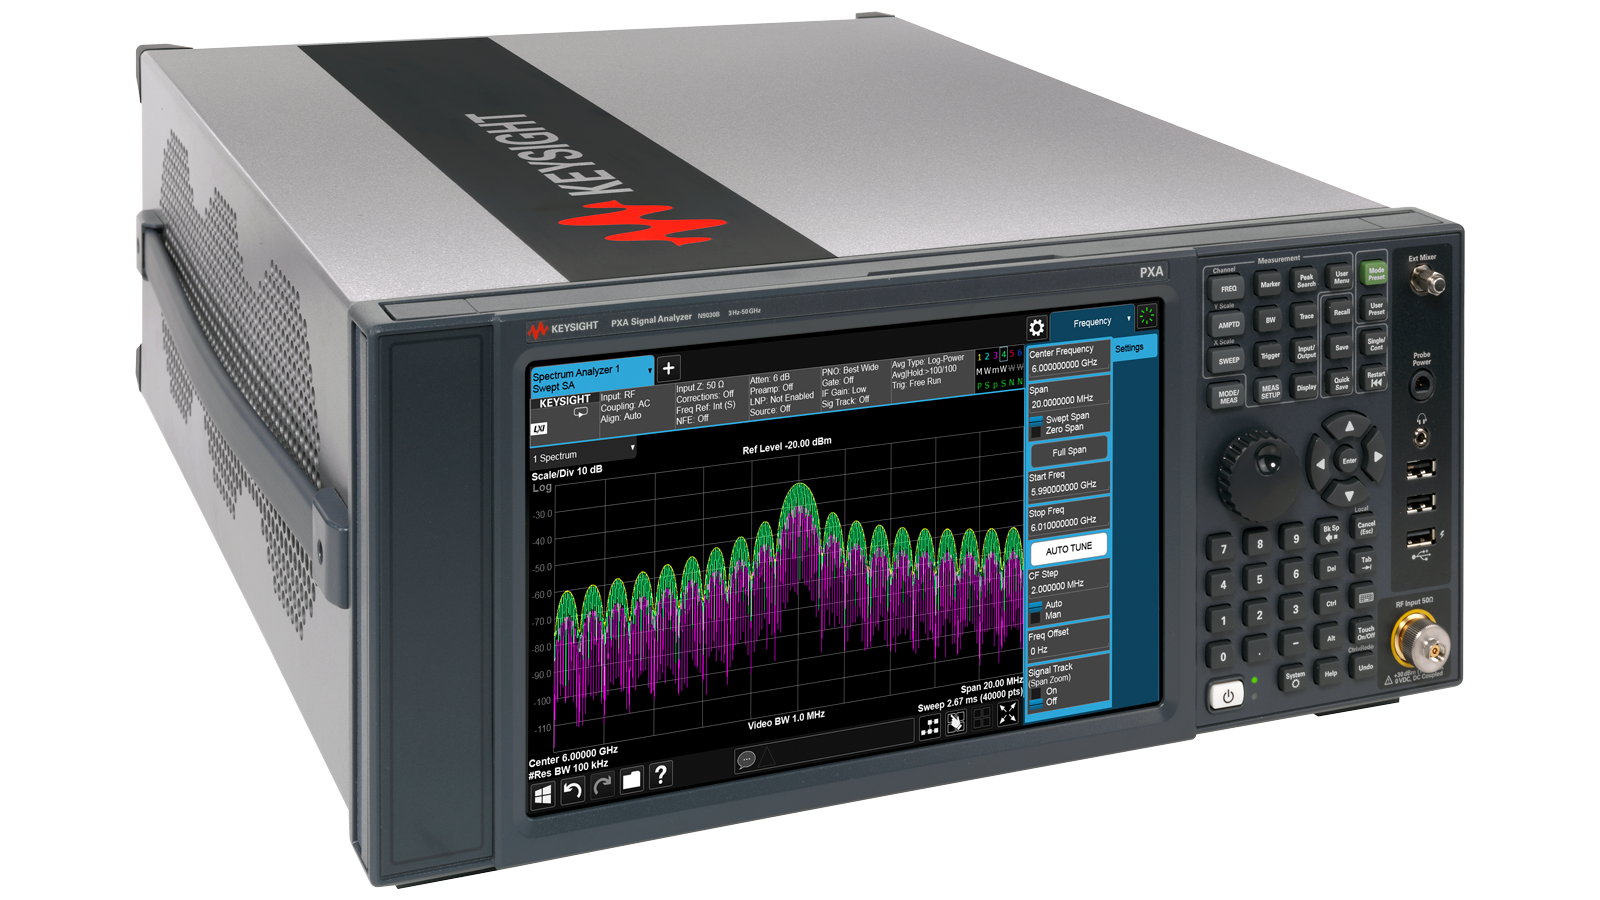





 粤公网安备44030902003758