是德科技 | KEYSIGHT
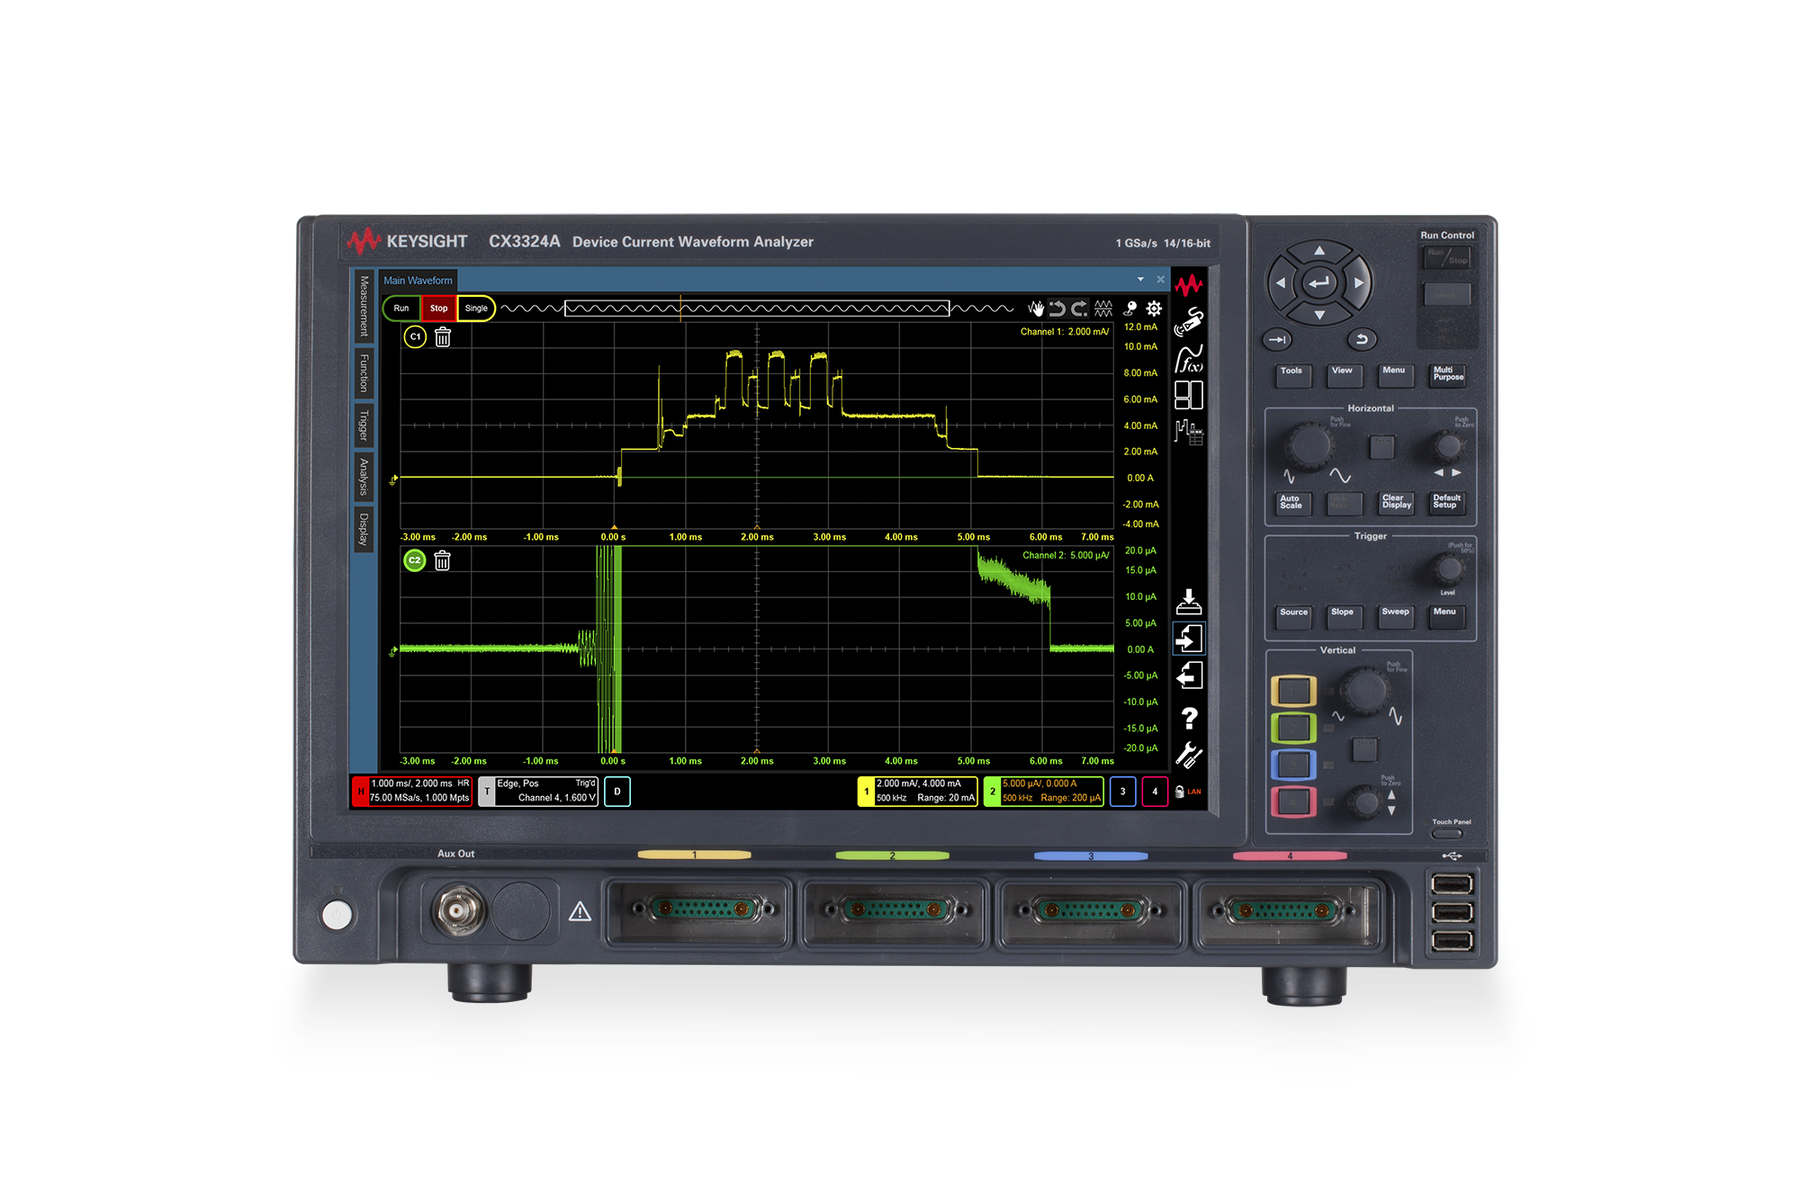
CX3324A 分析仪 详细指标
High-precision dynamic current and voltage measurements
条件:mainframe unless otherwise stated.
• Specifications are valid after a 30-minute warm-up and 23
± 5 °C. Warranted specifications
are denoted by **. All others are supplemental characteristics.
• Measurement accuracy is affected by RF electromagnetic fields with strengths higher than
3 V/m in the frequency range of 80 MHz to 2 GHz, or 1 V/m in the frequency range of 2 GHz to
27 GHz. The extent of this effect depends on instrument positioning and shielding.
• All sensor characteristics are defined by the
14-bit acquisition resolution of the CX3300
• Sensor maximum bandwidth is standalone bandwidth. The following equation can estimate the
effective bandwidth when connected to the mainframe.
0.35/bandwidth calculates rise and
fall times (10% to 90%).
•
�
Figure 23. BenchVue test sequence using a Keysight
33622A waveform generator and a
CX3324A to make a simple pulse measurement
33622A
Comparison of CX3322A and CX3324A
Number of analog channels
4
Number of digital channels N/A
8 with CX1152A
Max. analog bandwidth 1 50 MHz
100 MHz, or 200 MHz
Max. memory depth 1 4 Mpts, 16 Mpts
64 Mpts or 256 Mpts
条件:1. Maximum bandwidth and memory depth are selectable at ordering. Upgradable by license.
2. Data logger mode is optional, upgradable by license.
Vertical System – Performance Characteristics (Scope Mode and
Data Logger Mode)
1. ADC offset user calibration necessary
Horizontal System — Performance Characteristics (Scope Mode And
Vertical Hardware Resolution 16-bit
14-bit
Analog bandwidth (–3 dB) 14 MHz 50 MHz 100 MHz
200 MHz
RMS noise (±0.5 V fix, full BW) 46 μVrms 120 μVrms 170 μVrms
250 μVrms
条件:Input range ±0.65 V nominal, ±2 V peak
Input impedance ** 50 Ω
±3.5%
DC measurement accuracy ** ± (0.7% of reading + 0.7% of range)
1
Main time base range
1 ns/div to 10 ks/div
Reference position Left, center, right
条件:1. All channels are set to the same resolution.
2. Memory depth selectable when ordering; upgradable by license.
3. Per -channel filters characterized by math functions.
1. Data logger mode is an option, selectable at ordering and upgradable by license.
2. Only analog channel data is stored in data logger mode.
3. All channels are set to the same resolution. Effective sampling rate depends on the number of measurement channels
and storage data transfer performance. 4. Recommend USB 3.0 UASP (USB Attached SCSI Protocol) storage device.
Time scale accuracy
10 ppm
Channel deskew Range =
-100 to +100 ns
Acquisition System - Performance Characteristics (Scope Mode)
Acquisition System – Performance Characteristics (Data Logger
Maximum real time sample rate 1 14-bit
1 GSa/s for each channel
16-bit
75 MSa/s for each channel
Memory depth 2 4 Mpts, 16 Mpts
64 Mpts or 256 Mpts
Filters sin (x) / x interpolation
Averaging 1MHz, 2 MHz, 5 MHz, 10 MHz, 20 MHz, 50 MHz, 100 MHz
3
Low-frequency noise suppression mode (16-bit high-resolution mode only)
Maximum real time sample rate 3 14-bit
10 MSa/s
Maximum record time
100 hours for each channel
Filters Low-frequency noise suppression mode (16-bit high-resolution mode only)
Storage Internal SSD and external SSD/HDD
4
Embedded OS Recommend Windows
10
条件:1. Maximum sample rate is achievable when the signal noise floor is lower than 128LSB p -p; otherwise, data loss may
occur. 2. Effective sampling rate depends on the storage data transfer performance. Recommend checking the maximum sampling rate with using the performance check tool furnished with the CX3300 series while using third -party external storage.
Maximum sampling rate1
Maximum recording time limitation by free disk space
条件:1. Store s the additional information for waveform analytics .
• Maximum recording time o Free disk space minus reserved disk space/(typical sample point size x sample rate x number of channels)
• Reserved disk space = 2 GB (gigabytes)
1
• Typical sample point size =
1.7 bytes
Data file size created by a data logger mode measurement
条件:1. Depend s on the signal noise floor.
Trigger System – Performance Characteristics (Scope Mode) 1. Trigger level range for analog channels is the same as the sensor range connected to the mainframe. ± Sensor range = ± 4 div. at default setting.
• Data file size = Sample point size x recording time x sample rate x number of channels
• Sample point size = 1.5 to 2.5 bytes
1.
Number Of Measurement Channels Maximum Sampling Rate (ADC)
2
1 10 MSa/s (14-bit)
7.5 MSa/s (16-bit)
2 5 MSa/s (14-bit/16-bit)
4 2 MSa/s (14-bit/16-bit)
Source CX3322A Channels
2, aux, and line
CX3324A Channels 1, 2, 3
4, aux, line, and digital channels
Sensitivity Analog channel
5% of sensor range
External trigger input: DC to 100 MHz (minimum input
300 mVpp)
Trigger level range Analog channel: ± sensor range
1
触发 · 数字通道: 见数字通道特性 · 数字通道: 见数字通道特性
External trigger Input
±8 V (1 MΩ)
External trigger output: 2.5 V (50 Ω
100 ns pulse width)
Analog channel DC: high frequency reject (50 kHz low pass filter)
DC or AC: (10 Hz) low frequency reject (50 kHz high pass filter),
high frequency reject (50 kHz low pass filter)
Sweep modes Auto, triggered, single
Trigger holdoff range
100 ns to 10 s
Trigger actions Specify an action to occur and the frequency of the action when a
Edge (analog and digital) Rising, falling, either
Edge transition (analog) Rising edge > time, rising edge < time,
falling 边沿 > 时间, falling 边沿 < 时间
Glitch (analog and digital) Positive glitch > time, positive glitch < time, positive glitch in range,
Negative glitch > time, negative glitch < time, negative glitch in range
Pulse width (analog and digital) Positive pulse width > time, positive pulse width > timeout,
positive pulse width < time, negative pulse width > time, negative pulse width > timeout, negative pulse width < time
Runt (analog) Positive runt, positive runt (time-qualified), negative runt, negative
Timeout (analog and digital) High too long, low too long, unchanged too long
Pattern entered, pattern exited, pattern present > time, pattern
present > timeout, pattern present < time, pattern present in range
State (analog and digital) Rising edge (AND), rising edge (NAND), falling edge (AND), falling
edge (NAND), either edge (AND), either edge (NAND)
Window (analog) Entering range, exiting range, inside range > time, inside range >
timeout, inside range < time, outside range > time, outside range >
条件:1. Trigger setting is not mandatory for measurement in data logger mode. The trigger in the data logger mode may be used
to segment the triggered events for the waveform analytics in the analysis.
1. CX1152A digital channel interface is required.
2. Memory depth depends on the analog channels.
Trigger System - Performance Characteristics (Data Logger Mode)
1
Digital Channel Characteristics (CX3324A Only)
1
Trigger level range Analog channel: ± sensor range
1
Trigger holdoff range
100 ns to 1 s
User-defined threshold range ±25 V
10 mV step
Maximum input voltage
±40 V peak
Threshold accuracy ±(150 mV +
3% of threshold setting)
Minimum input voltage swing
500 mV peak-to-peak
Input impedance 10 MΩ ±2% with approximately
8 pF in parallel
Channel-to-channel skew
4 ns
Acquisition System - Performance Characteristics (Scope Mode)
Maximum real time sample rate
500 MSa/s
Maximum memory depth per channel
128 Mpts
Minimum width glitch detect
7 ns
二、Mainframe Platform Specifications
条件:1. USB communication functionality can be affected by RF electromagnetic field having the strengths greater than 3 V/m in
depends upon how the instrument is positioned and shielded. 2. LXI compliance: LXI 1.4 Core, LXI HiSLIP, LXI IPv6.
the frequency range of 80 MHz to 2 GHz or 1 V/m in the frequency range of 2 GHz to 27 GHz. The extent of this effect
Computer System and Peripherals
Operating system Windows
10 IoT
CPU
3 GHz Intel i5 quad-core
Display WXGA 14.1” capacitive multi-touch screen (1280 x
800 pixels)
PC ports 1 USB2.0, USB3.0, 10/100/1000 LAN, LXI
2 LAN (web-enabled remote
Drives (SSD) ≥
250 GB removable SSD
Display Internal display WXGA 14.1” capacitive multi-touch screen (1280 x
800 pixels)
External display VGA and DisplayPort (drivers support up to two simultaneous
Peripherals Optical USB mouse and compact keyboard provided. All models
support any Windows compatible input device with a USB interface.
Aux output ±7 V max.
±200 mA max.: DC, pulse, square
Time base reference output 10 MHz, 8.33 dBm (Vpp = 1.65 V) into
50 Ω
Time base external reference input 10 MHz, 16 dBm (Vpp = 4 V) max. into
50 Ω
条件:Humidity Operating Up to 80% relative humidity (non-condensing) at 40 °C
Storage Up to 90% relative humidity (non-condensing) at 60 °C
Temperature Operating
0 °C to 40 °C
Altitude Operating Up to 2000 meters
Storage Up to 4600 meters
Power 100 V to 240 V ±10%
50 Hz/60 Hz
Max power dissipated
250 VA
Dimensions (feet retracted) 425.6 mm (W), 266.1 mm (H)
196.7 mm (D)
Electromagnetic compatibility IEC
61326-1
CX3300 Mainframe Schematic Diagram
425.6
280.5
266.1
幅度峰值-to-peak, 最小值, 最大值, average, DC
RMS, AC RMS, amplitude, base, top, overshoot, preshoot, upper, middle, lower
Time Rise time, fall time, positive width, negative width, period, frequency, duty cycle, Tmin, Tmax
Math functions
1 Operators Add, subtract, multiply, divide, absolute value
average, delay, invert, magnify, max, min, differentiate, integrate, square, square root
Analysis Markers Crosshair, A-B, area
Statistics analysis Mean, min, max, standard development for waveform
Amplitude analysis Histogram (hits, PDF, CDF, CCDF) and statistics with
Magnitude and phase with horizontal gating, up to 1
X-Y analysis Up to 1 Mpts
View Waveform, histogram, spectrum, statistics, setup summary, sidebar
Display style Waveform area Single, dual, single plus anywhere zoom (vertical, and
功率和电流 Profiler - 测量和 Analysis
条件:The power and current profiler automatically adjust the time scale by the vertical level difference.
It instantly calculates critical parameters such as average current, maximum/minimum current, and
accumulated charge. The data displays in a table format. You can also adjust the segment
manually according to your measurement profile. It eliminates time-consuming power and current
The followings are recommended to take full advantage of the data logger mode analysis
capabilities: Windows 10, USB 3.0, and a storage device supporting USB
3.0 UASP (USB Attached
When the waveform is recording in the data logger mode, the recording view displays in the main
display window. Measurement data streams into the database on a storage device and displays for
you to preview. Use the waveform playback to analyze the data. Note: Recording view has the
条件:embedded memory from storage. The waveform navigates by time as well as by trigger point.
Waveform playback is the main display window in the data logger mode except for waveform
recording. Waveform playback allows the measurement setup for data logger mode measurement
and the post-measurement analysis. It can playback the waveform by reading the data set on the
Measurements, math, and analysis capabilities are available in the waveform memory as well as
The trigger setting is not mandatory to measure in data logger mode. However, the triggering
capability can be used to tag the specific triggered events in the waveform during the
measurement. The trigger information is helpful to identify the specific point in the long-duration
measurement for analysis. The triggered segments are tagged with similarity cluster information in
the database for waveform analytics. Using triggered segmentation feature can affect the
effective sampling rate because of data processing bandwidth.
Triggered segmentation is in progress during the measurement. Use the following recommended
Waveform Analytics enables you to classify the triggered segments up to 12 clusters. You can quickly identify the specific waveform pattern or anomaly with visual readings. This feature can be used in waveform
Recommended Settings of Triggered Segmentation
Number of segments
<5,000,000 segments /100s
Segment density <1 segment/20us (number of measurement channel is
1 or 2)
<1 segment/50us (number of measurement channel is
3 or 4)
Number of tags 20 to 500 (typical application such as BLE, similarity =
90% to 99%)
10 to 50 (Multi-tone signal, similarity =
70% to 95%)
1 to 2 (perfectly repetitive signal such as power line, similarity =
99% to
99.7%)
条件:The waveform trend analyzer provides an analytics approach for long-duration measurement data.
It visualizes the trend of statistical parameters (min, max, average, and charge) of each segment
for the entire waveform via a trend chart and list. It supports a CCDF chart (histogram, PDF, CDF,
CCDF). The waveform trend analyzer allows you to estimate the area to view and load for an in-
条件:mode. 3. Data logger measurement automatically creates the database. Waveform data can be extracted with a specified duration and saved as a new database.
Data File Functions (Scope Mode and Data Logger Mode) 1. Autosave function enables you to save the file per measurement. 2. Store long -duration measurement data in the waveform database. Data size in the memory depth (max. 256 Mpts) displays on the screen. Only the waveform database stores the entire waveform measurement data of the data logger
Scope mode Composite (including all setup and result) Yes
1 Yes
Waveform Waveform Yes
1 Yes
Screen capture JPG, BMP, PNG Yes
Waveform Database Waveform database
3 Yes Yes
HDF5 Yes
CX3300APPC Current Waveform Analytics Software
CX3300APPC current waveform analytics software provides the same analysis capabilities as the
CX3300 series firmware except for the measurement execution. A software license is required,
Computer system and peripherals
Operating system Windows 10 64-bit or Windows 11
64-bit
Processor Greater than or equal to 3 GHz
Memory Greater than or equal to 8 GB
Disk space Greater than or equal to 20 GB
Graphics card DirectX
11 or later
Display resolution Greater than or equal to 1280 x
800 (WXGA)
Computer system and peripherals
Operating system Windows 10 64-bit or Windows 11
64-bit
Display resolution 1280 x
800 (WXGA)
CX3300A Current and Voltage Sensors
Maximum standalone bandwidth 100 MHz 100 MHz 200 MHz 20 MHz 100 MHz
300 MHz
Effective bandwidth 1 < 90 MHz < 90 MHz < 140 MHz < 20 MHz < 90 MHz <
165 MHz
1 A
(10 A) 1 A 20 mA 15 A
100 A
(realistic max.)
8 V (1:1 probe)
RMS noise 1 40 nA 2 40 nA 2 150 pA 2 22 μA 2 20 μV 2 90 μV
3
Dynamic range Over 80 dB Over 100 dB Over 80 dB Over 80 dB Over 80 dB Over
80 dB
Typical insertion resistance
410 mΩ
(50 Ω)
410 mΩ
(50 Ω) 4 Ω (50 Ω) 5.5 mΩ to 1 Ω 4 N/A
5 N/A
Maximum common mode voltage ±40 V ±12 V ±0.5 V ±40 V ±40 V or ±6 V
±8V
(1:1 probe)
Required number of channels 1 2 1 1 1
1
五、CX1101A Single-通道电流传感器规格
CX1101A Single-通道电流传感器规格 · 特性
条件:1. CX1206A is used for 10A range and CX1203A is used for all other ranges.
2. CX1203A slide switch set to “0 Ω”.
3. Bandwidth at - 4 dB.
4. Sensor built -in low pass filter is set to “on.”
5. CX1101A’s firmware version must be 2.0 or later to enable these ranges.
1. Accuracy is defined as gain [% of readings] + offset [% of range] at V CM = 0 V (zero common- mode input voltage at
either +I IN or -IIN ). Add 0.7% typical to offset error for V CM up to 40 V. The reading is defined as the measured value. DC
measurement condition at 20 ms averaging.
2. After executing the user calibration with the mainframe.
CX1101A Current Measurement Characteristics Overview
CX1101A DC Measurement Accuracy
1
Range RIN
2 Noise (rms) at 20 MHz NBW Maximum Bandwidth (-3 dB)
10 A 15 mΩ (typical) 10 mA 3 MHz
3
1 A
410 mΩ (typical)
550 mΩ (max)
77 Ω (max)
Range Standalone With Mainframe 23 ± 5 ºC 23 ± 5 ºC TUSERCAL ± 3 ºC, 24 hrs. 2 10 A ± (5% + 5%) ± (5.7% + 5.9%) N/A 1 A ± (2% + 2%)** ± (2.7% + 2.9%) ** ± (1.8% +
0.4%)
200 mA ± (2% + 2%)** ± (2.7% + 2.9%) ** ± (0.7% +
0.4%)
20 mA ± (2% + 2%)** ± (2.7% + 2.9%) ** ± (0.6% +
0.3%)
2 mA ± (2% + N/A)** ± (2.7% + N/A) ** ± (0.7% +
1.1%)
200 µA ± (2% + 2%)** ± (2.7% + 2.9%) ** ± (0.7% +
0.3%)
20 µA ± (2% + N/A)** ± (2.7% + N/A) ** ± (0.7% +
1.1%)
六、CX1101A Additional Specifications
条件:1. Measured with a CX1201A. Both inputs have the same input impedance. When using a CX1203A sensor head, the minus
terminal is internally connected to the circuit common through a 10 M Ω resistor.
2. For all current measurement ranges.
3. 125mA when using CX1203A with 50 Ω setting.
4. See CX1100 User’s Guide (CX1100- 90000) for more information.
1. Refer to mainframe’s “Environmental and General” for additional information.
2. Includes CX1203A sensor head; does not include cable and adapter.
3. Included in CX1203A sensor head.
CX1101A General Information
1
七、Additional Specifications
条件:Input common-mode impedance 1 750 MΩ // 31 pF (nominal)
Measurable over range
10% of range
Burden voltage RIN x measured current
Maximum input voltage (common mode) 2 Peak voltage (DC + AC) limit
±40 V
AC voltage limit ±5 V above
1 MHz
Absolute maximum input current
4
20µ and 200 µA ranges A
Cable length Sensor cable: 1.5 m, GND lead
16 cm
Dimension 2 46.8 mm (W), 31.9 mm (H)
205.3 mm (D)
Accessories included
1 each coaxial termination adapter sensor head (CX1203A)
1 each coaxial cable, SMA plug to open, 100 mm (8121-2773)
3
1 each coaxial cable, SMA plug to MHF plug, 100 mm (8121-2774)
3
1 each MHF pulling tool (8710-2791)
3
5 each coaxial cable, MHF plug, shorted, 21 mm (8121-2780)
3
5 each RF connector, MHF jack straight SMT (1250-3656)
3
1 each SMA(P) to BNC(J)
50 Ω coaxial adapter (1250-3975)
1 each GND lead (C1101-61711)
以上指标摘自厂家官方数据手册,完整定义、测试条件与保证值口径以手册为准。完整指标、测试条件与定义口径请见产品页「软件和手册 | 白皮书」栏目中的官方数据手册。
是德科技 | KEYSIGHT · onetest 仪器资源库


 客服





 粤公网安备44030902003758